Soot aggregate mechanics simulation software with a graphical interface
We have implemented a graphical user interface for our soot aggregate mechanics engine soot-dem. Binary packages are available for Windows and macOS. Discrete element method modeling has never been this easy!
Intro
Information about the soot aggregate mechanics engine developed by our group is available in the “How to model soot restructuring” post. The contact model is described in the preprint. In this post, we provide an introductory tutorial for the graphical user interface developed on top of our DEM engine.
Physics modules available as of v1.1
- Restructuring - fixed neck fraction. A soot restructuring simulation with a prescribed fraction of necks broken from the start. Force models: particle-particle friction, particle-particle van der Waals attraction, particle-particle elastic bonds, capillary force as a cutoff pair potential
- Restructuring - dynamically breaking necks. A soot restructuring simulation with all neighboring particles bonded with necks at the start. Necks have the ability to break when stress in them exceeds a threshold. Force models: particle-particle friction, particle-particle van der Waals attraction, breakable particle-particle elastic bonds, capillary force as a cutoff pair potential
- Aggregation. A soot formation simulation, can be used to generate mechanically stable initial structures for restructuring and deposition simulations. Particles with randomly oriented initial velocities are spawned in a confined box and are allowed to coagulate. Force models: particle-particle friction, particle-particle van der Waals attraction
- Deposition. A soot deposition onto a substrate simulation, can be used to generate initial structures for indentation and anchored restructuring simulations. An aggregate is collided with a flat substrate and adheres to it. Force models: particle-particle friction, particle-particle van der Waals attraction, particle-particle elastic bonds, particle-substrate friction, particle-substrate van der Waals attraction
- Indentation. A soot force spectroscopy simulation. An aggregate is indented and stretched with a tetrahedral AFM tip. Force models: particle-particle friction, particle-particle van der Waals attraction, particle-particle elastic bonds, particle-substrate friction, particle-substrate van der Waals attraction, particle-tip friction, particle-tip van der Waals attraction
- Anchored restructuring - fixed neck fraction. A soot restructuring simulation with a prescribed fraction of necks broken from the start and where the aggregate is adhered to a substrate. Force models: particle-particle friction, particle-particle van der Waals attraction, particle-particle elastic bonds, capillary force as a cutoff pair potential, particle-substrate friction, particle-substrate van der Waals attraction, particle-substrate capillary force
Part 1: getting started
To get started on Windows, download the .zip archive using the button above. This button is liked to the
most recent release of soot-dem-gui. A file soot_dem_gui-windows-x86_64.zip should be downloaded.
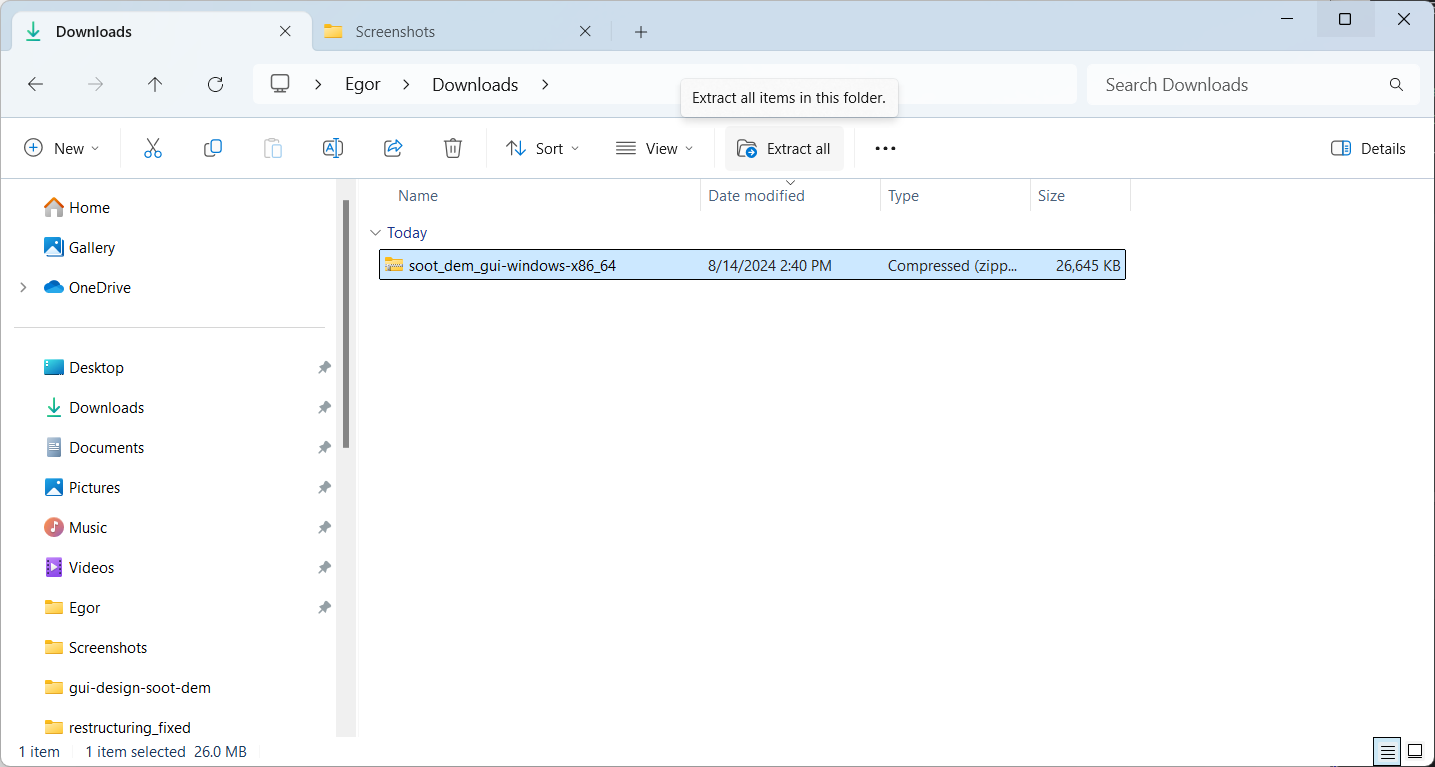
In file explorer, select the downloaded file and press “extract all” in the ribbon:
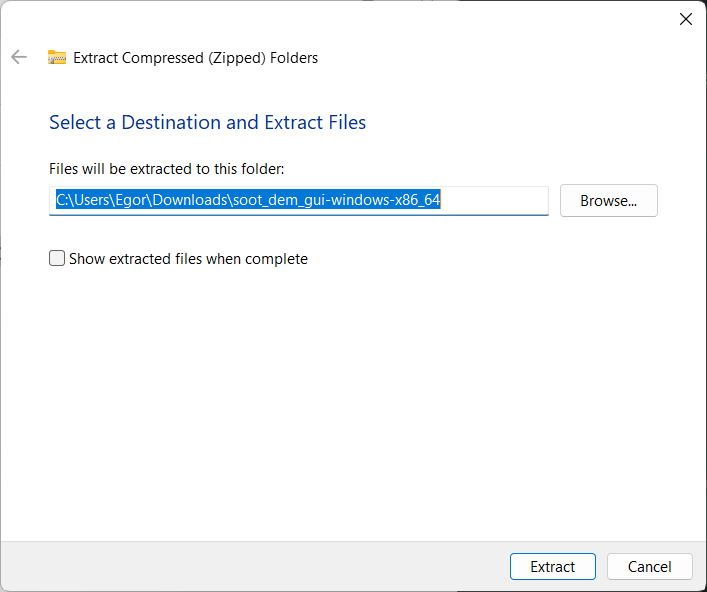
A prompt should appear asking to select the destination for the files. Leave the destination at the default value or configure it and press “extract” when ready:
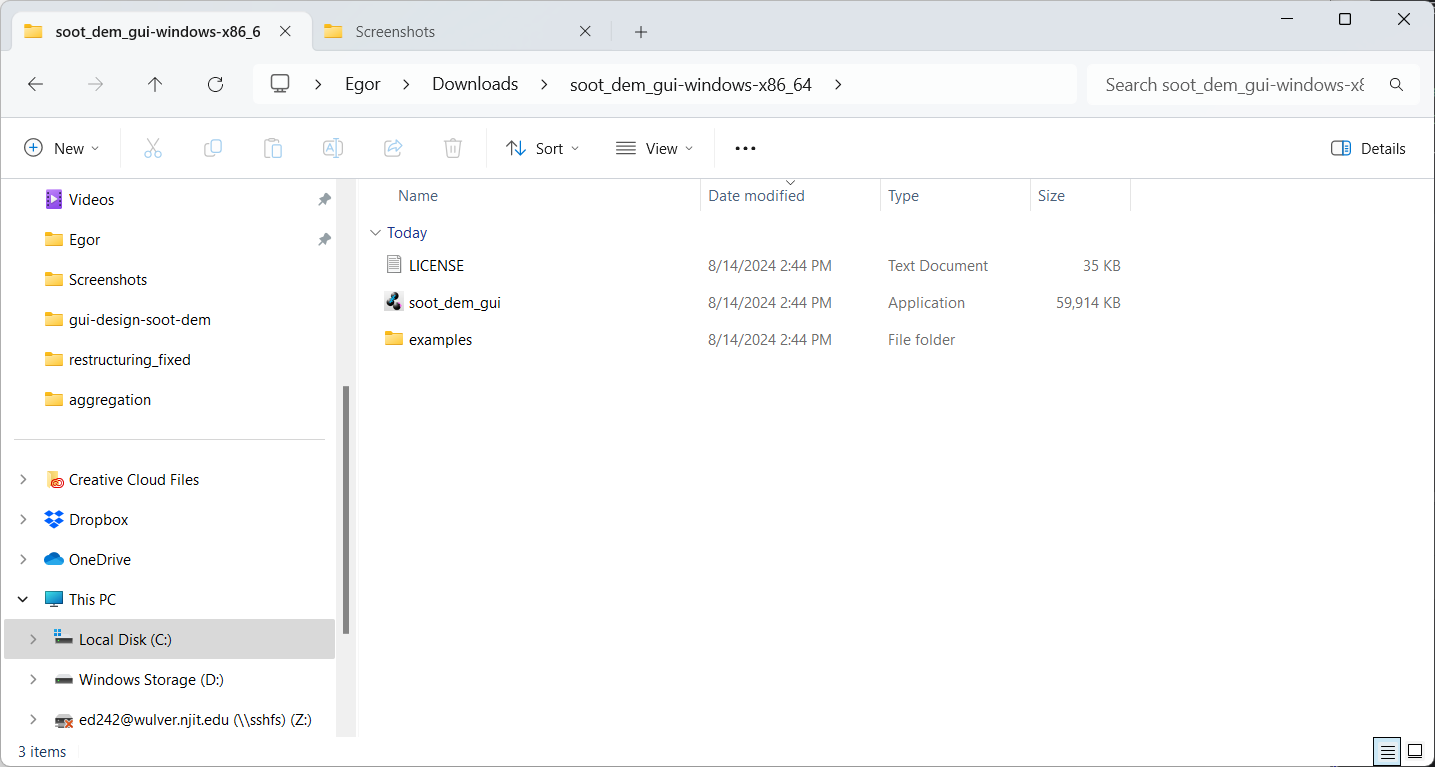
Open the destination folder, which should contain the extracted files - an executable, a copy of the license, and a folder with examples:
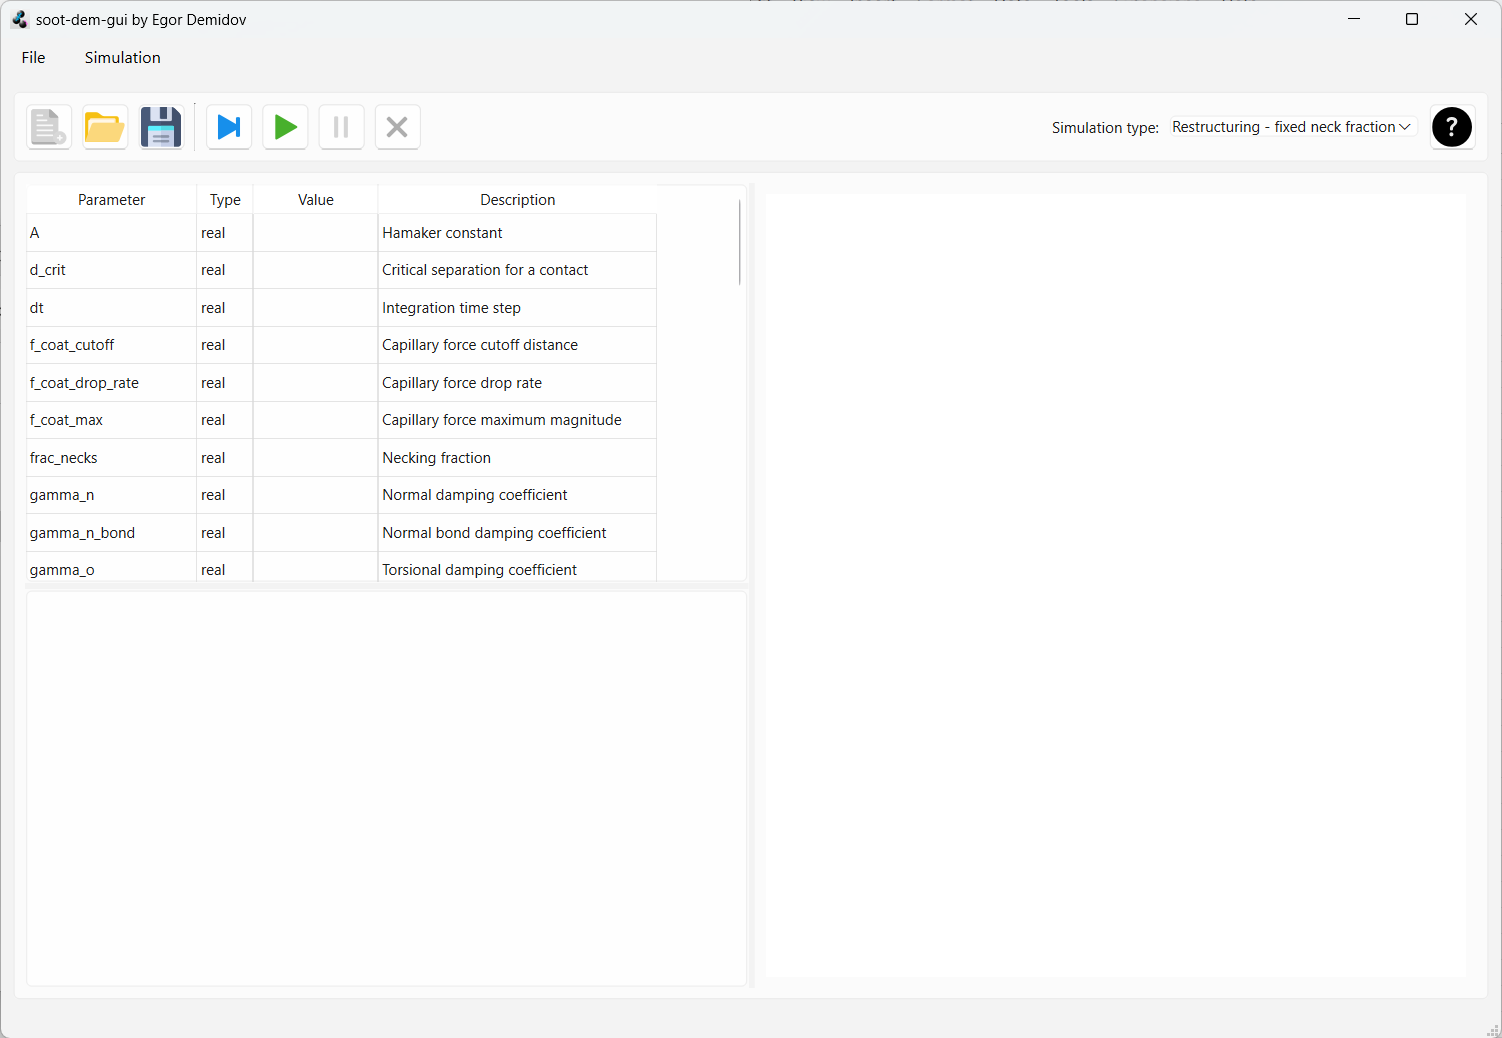
Double-click the executable soot_dem_gui.exe. If all steps were successful, you should
see the soot-dem-gui interface:
To get started on macOS, download the .zip archive using the button above. This button is liked to the
most recent release of soot-dem-gui. A file soot_dem_gui-macos-arm64.zip should be downloaded. Safari will
automatically extract the archive. Otherwise, double-click the .zip archive in Finder and you will end up
with a folder with a folder named soot_dem_gui-macos-arm64 that contains the application, simulation
examples, and a copy of the license:
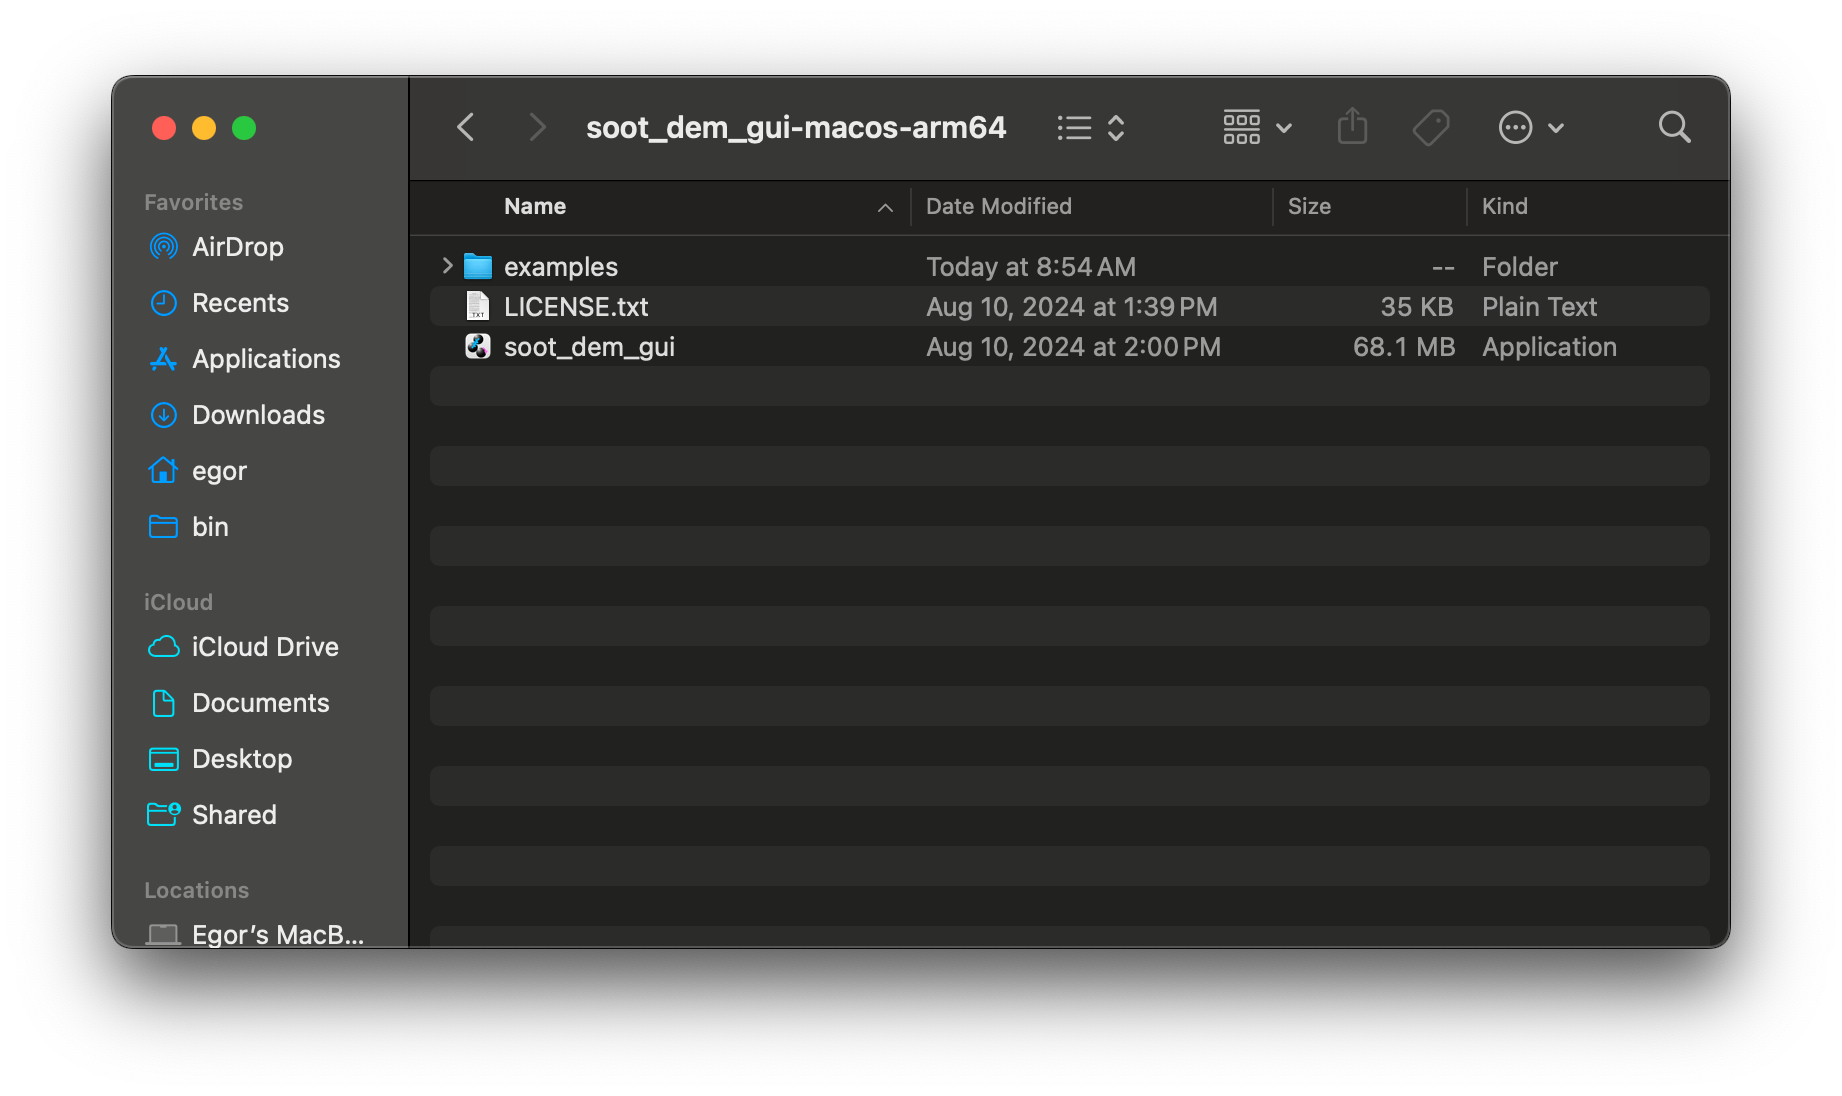
You may copy the application to /Applications folder if you want it to appear in your launchpad.
Double-click soot_dem_gui.app to launch it. A warning will pop up asking if you want to launch an app downloaded from internet:
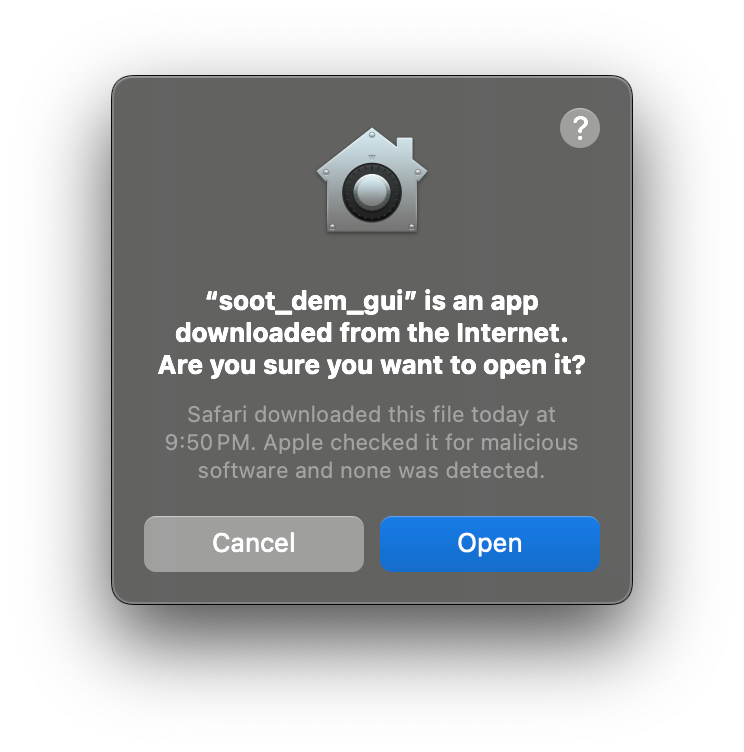
We submit every build to Apple for malware analysis, as noted in the warning message. Thus, you can be sure that the application is safe and press “Open”. If all steps were successful, you should see the soot-dem-gui interface:
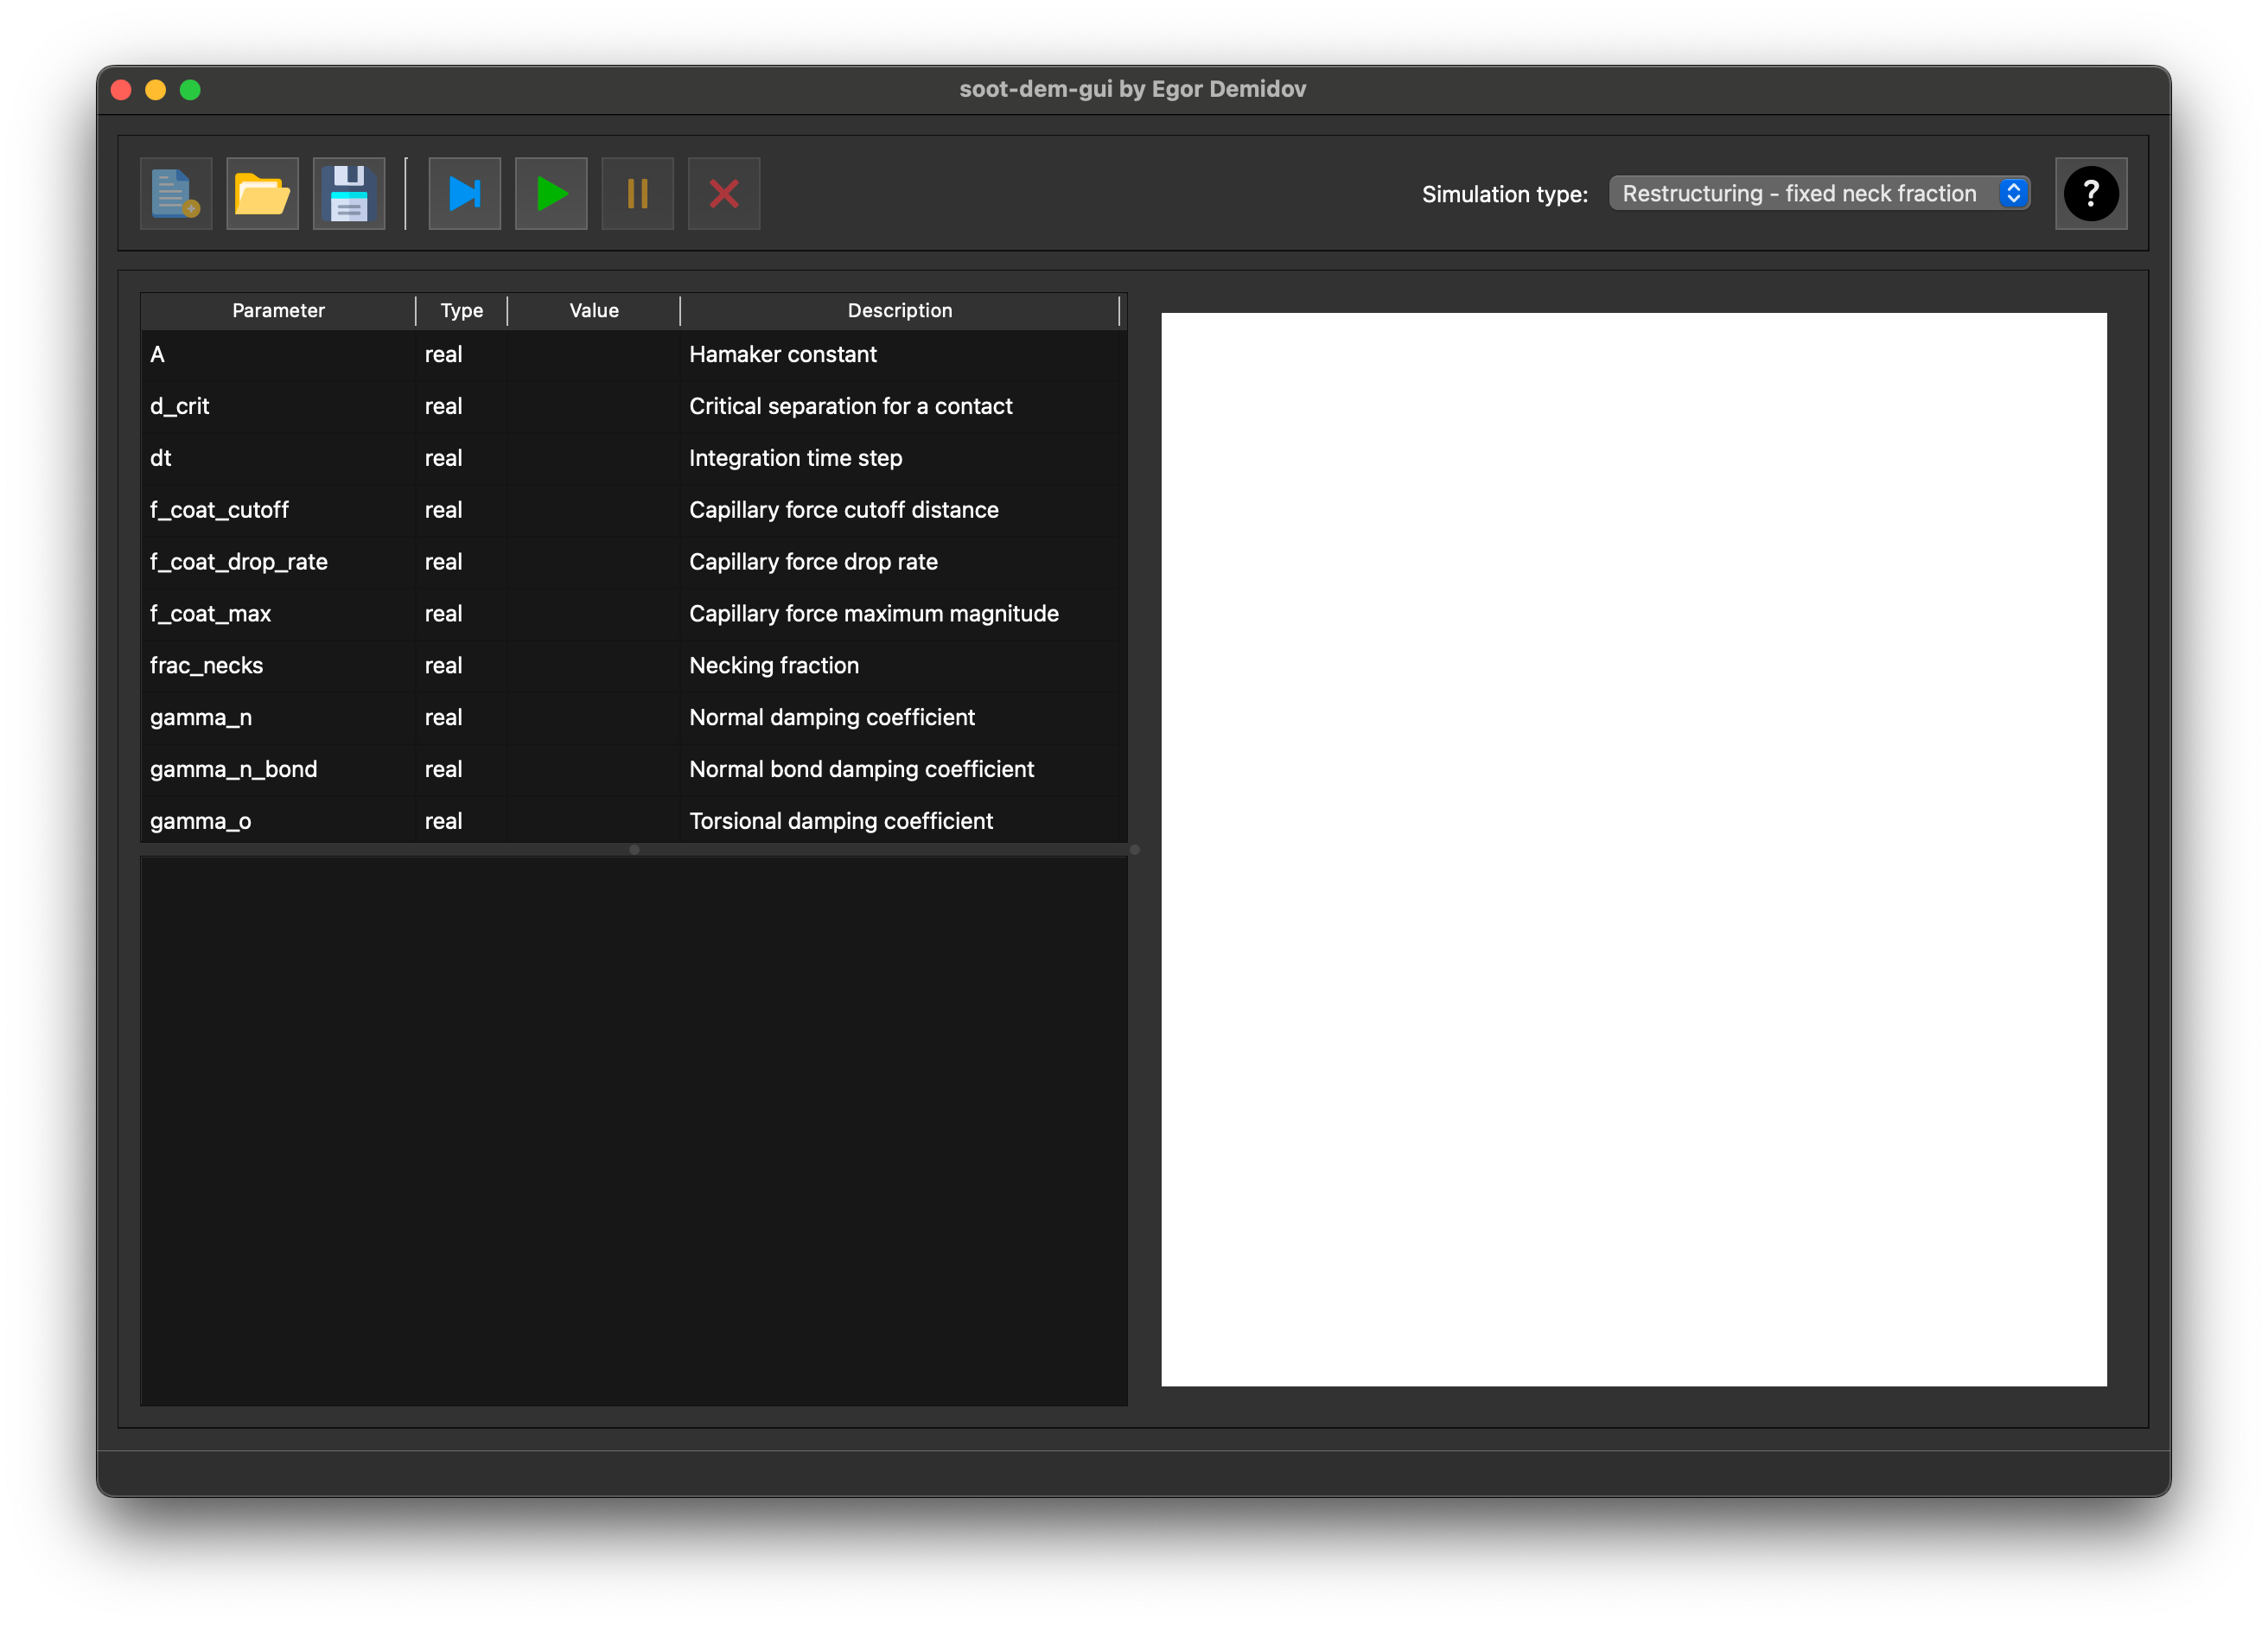
NOTE: this binary will only run on macs with Apple Silicon. To run it on older Intel-based macs, the app will need to be compiled from source.
Part 2: user interface elements
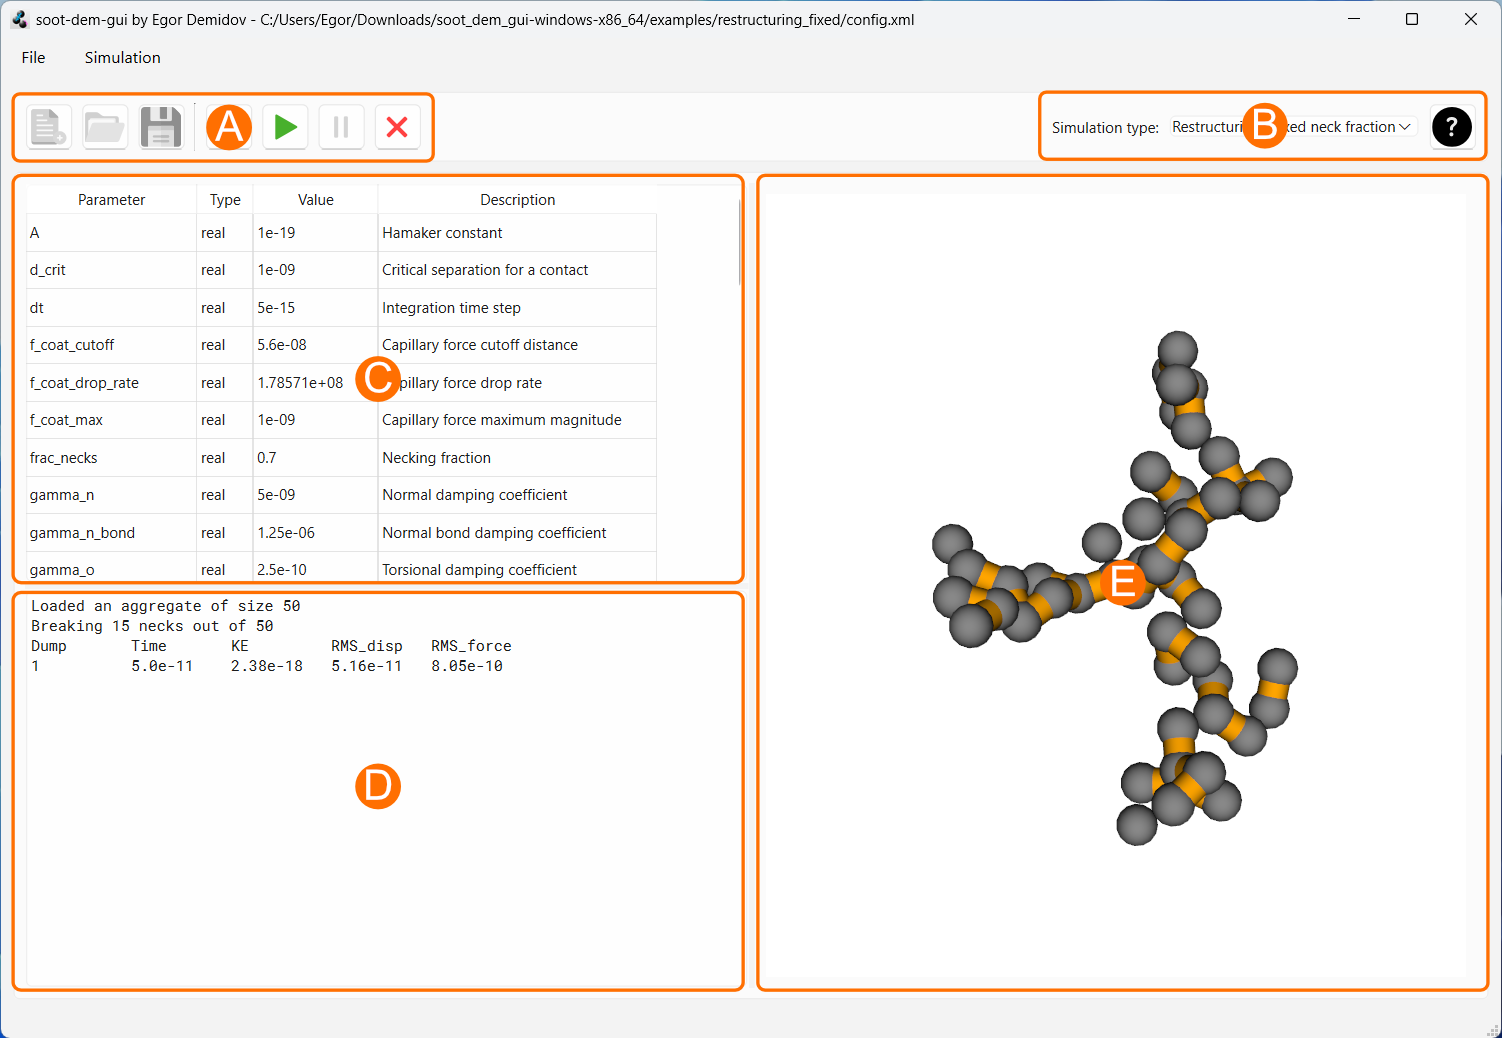
Section A
This section contains buttons that control configuration and simulation state
Section B
This section contains a dropdown menu that can be used to select the simulation type. As of version 1.0, restructuring with fixed necking fraction and aggregation simulations are available. More simulation types will be added in future releases.
Section C
This section contains a table with simulation parameters. The table updates every time the simulation type is changed using the menu in Section B, as different simulation types require different parameters. Pressing the “New” button in Section A resets all parameter values. Pressing the “Open” button in Section A and selecting a configuration file loads all parameter values from the configuration file an switches the simulation type, if necessary. Pressing the “Save” button in Section A stores the selected simulation type and the values of all parameters in a configuration file.
Every parameter is bound to one of four data types: integer, real, string, and path. Only the column “Value” is editable. The values can only be edited when the simulation is in reset state (see “Reset” button in Section A).
Section D
This section contains text output from the simulation engine. The output varies based on the simulation type and can be extended in the future. The output will generally contain the current data dump number, simulation time, total kinetic energy of the system, etc. The text output box is limited to 500 lines of text. After the length limit has been reached, adding a new line to the output will cause the earliest line to be deleted.
Section E
This section contains a 3D visualization of the most recent data dump from the DEM simulation. Each visualization contains the primary particles. Additional elements vary between simulations and can include elastic inter-particle necks, AFM tip, sample substrate, etc.
Part 3: running an aggregation simulation
In this section, we will slightly modify one of the example configuration files and run a diffusion-limited aggregation simulation. This will produce a soot aggregate, which will be restructured in Part 4 of the tutorial.
Step 1
Open soot-dem-gui and press the “Open simulation” button in the tool bar. In the file dialog, navigate to the “examples” folder that was bundled with soot-dem-gui. Inside “examples”, open the folder “aggregation”, select “config.xml” and press “Open”.
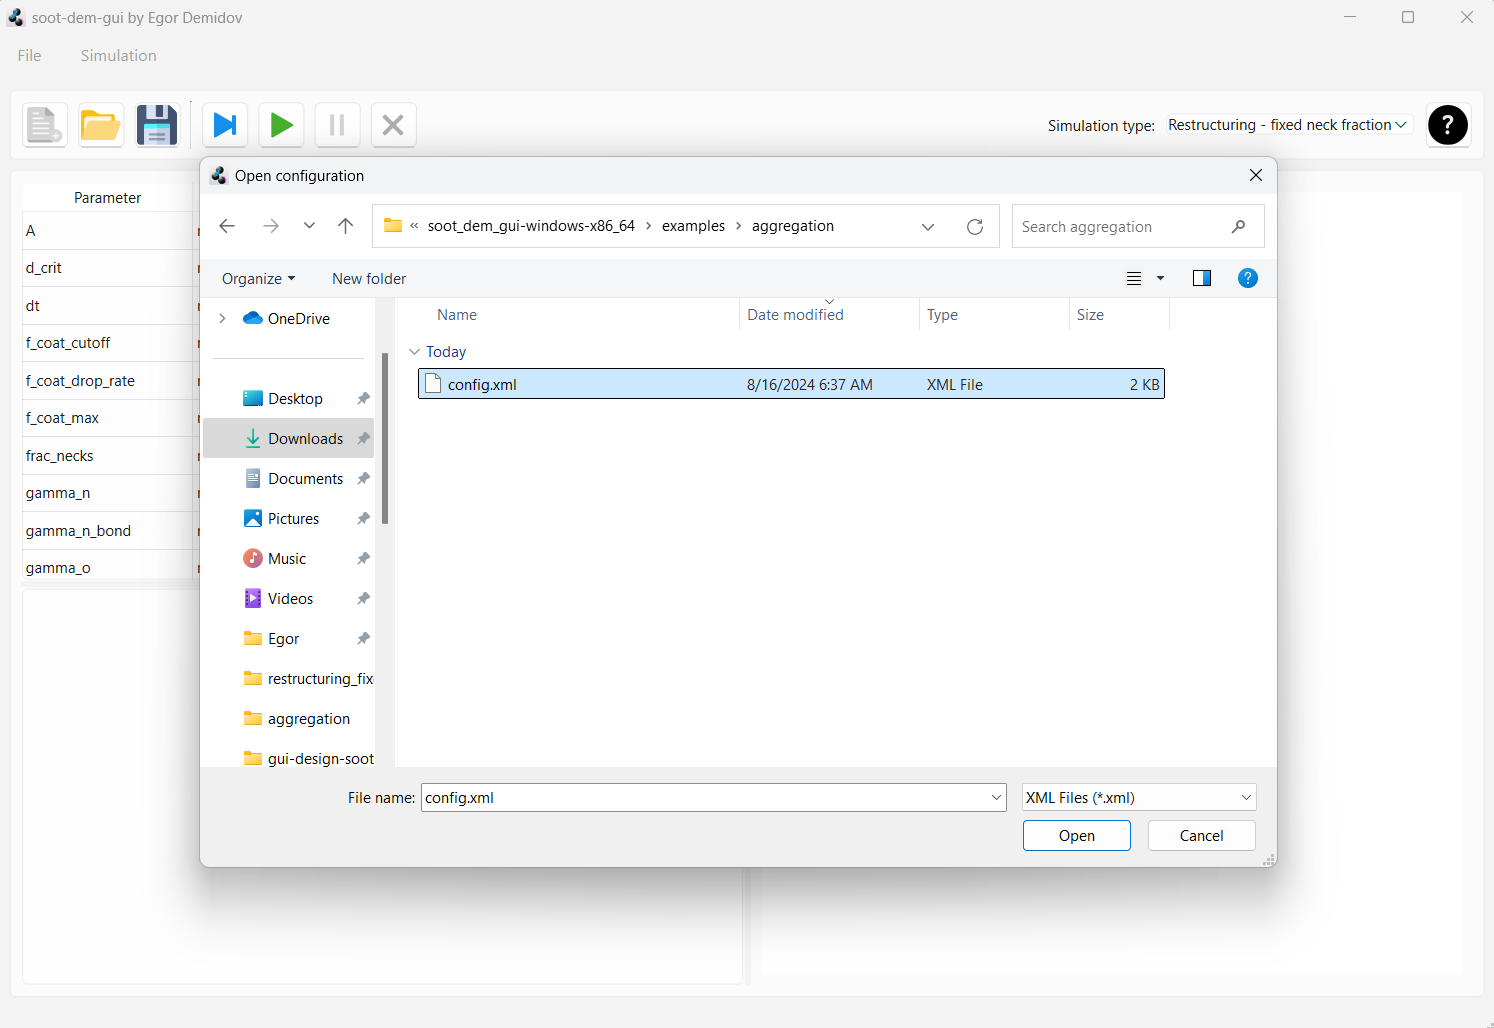
This will switch the simulation type to “Aggregation” and will populate the parameter table with values that were saved
in the example file. We will change some of the values to customize the simulation.
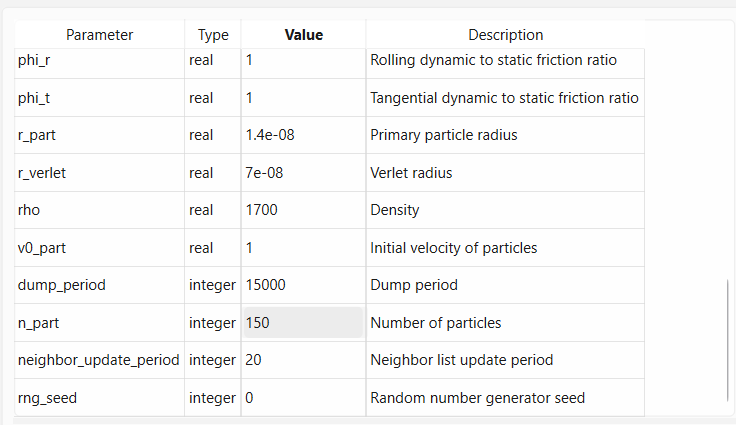
Find parameter box_size in the parameter table and set it to 3.0e-7. Now go to the n_part parameter
and set it to 150.
We do not want to overwrite the example configuration. Instead, go to “File > Save as” in the menu bar. Create a new folder called “soot formation” at some convenient location and save the configuration as “config” inside the newly created folder.
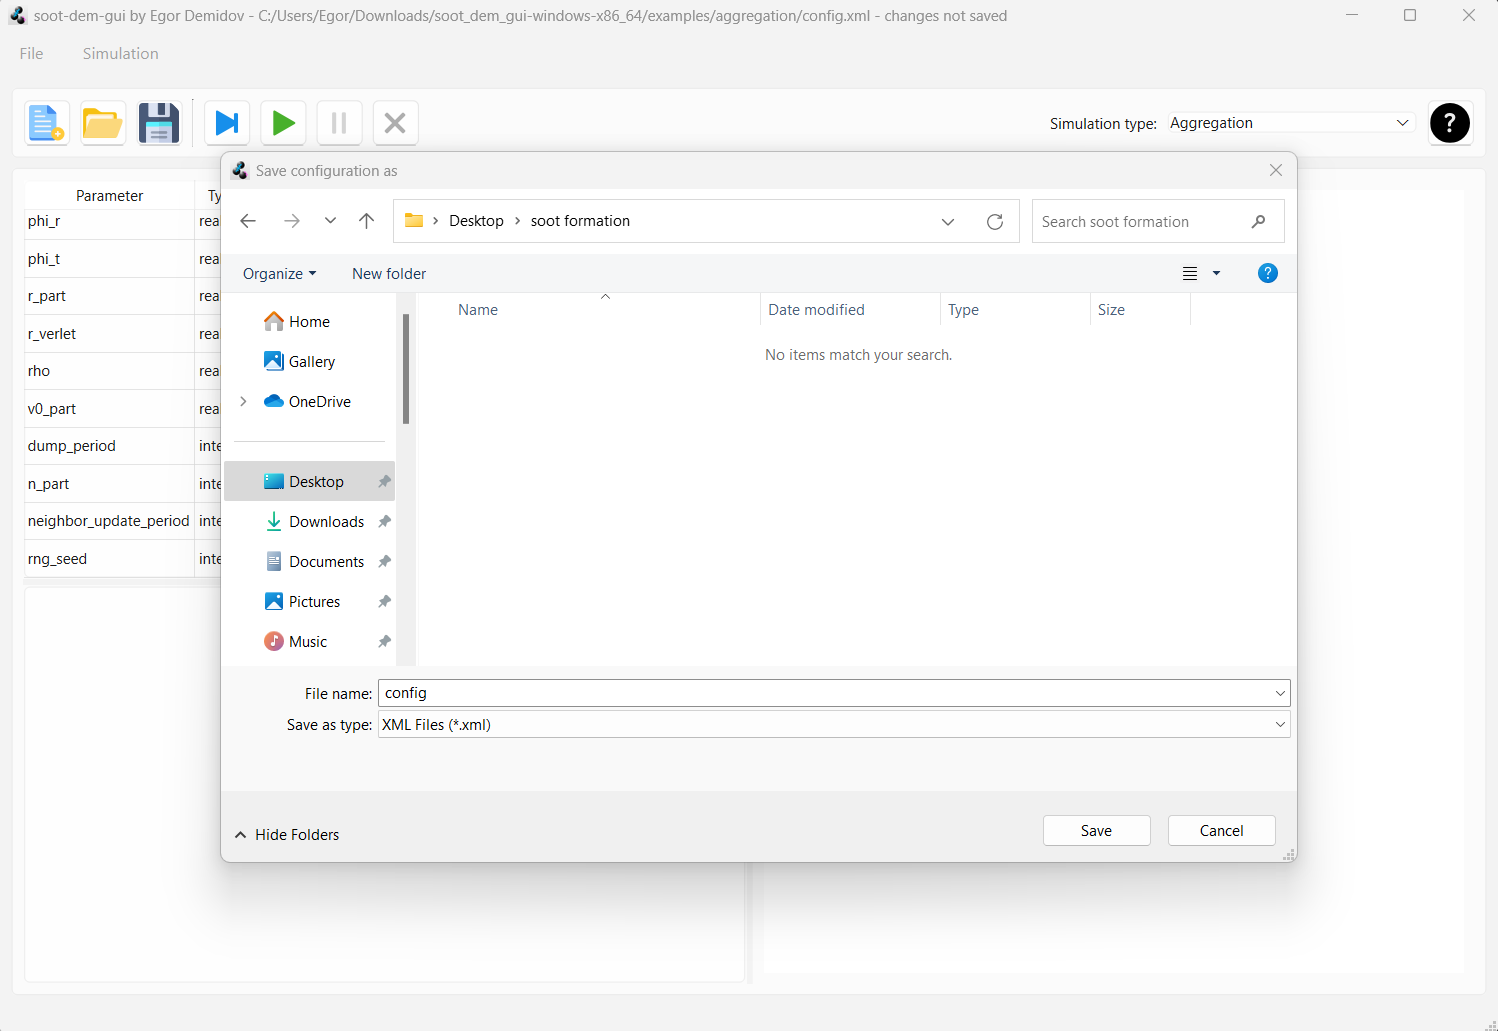
Note that the path to the current configuration file is displayed in the title bar of the main window. This is important because if you change a parameter and press the diskette icon to save the configuration, the file at the path indicated in the windows bar will be overwritten. Also, as you run the simulation, a folder named “run” will be created in the same directory as the config file and geometry dumps will be stored there.
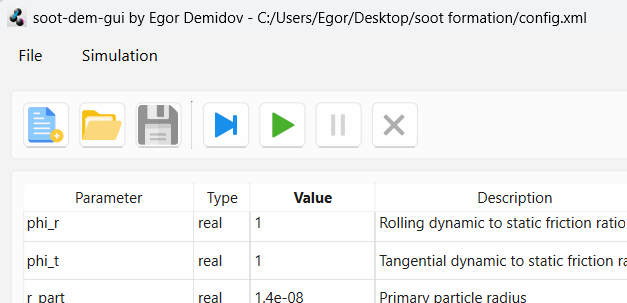
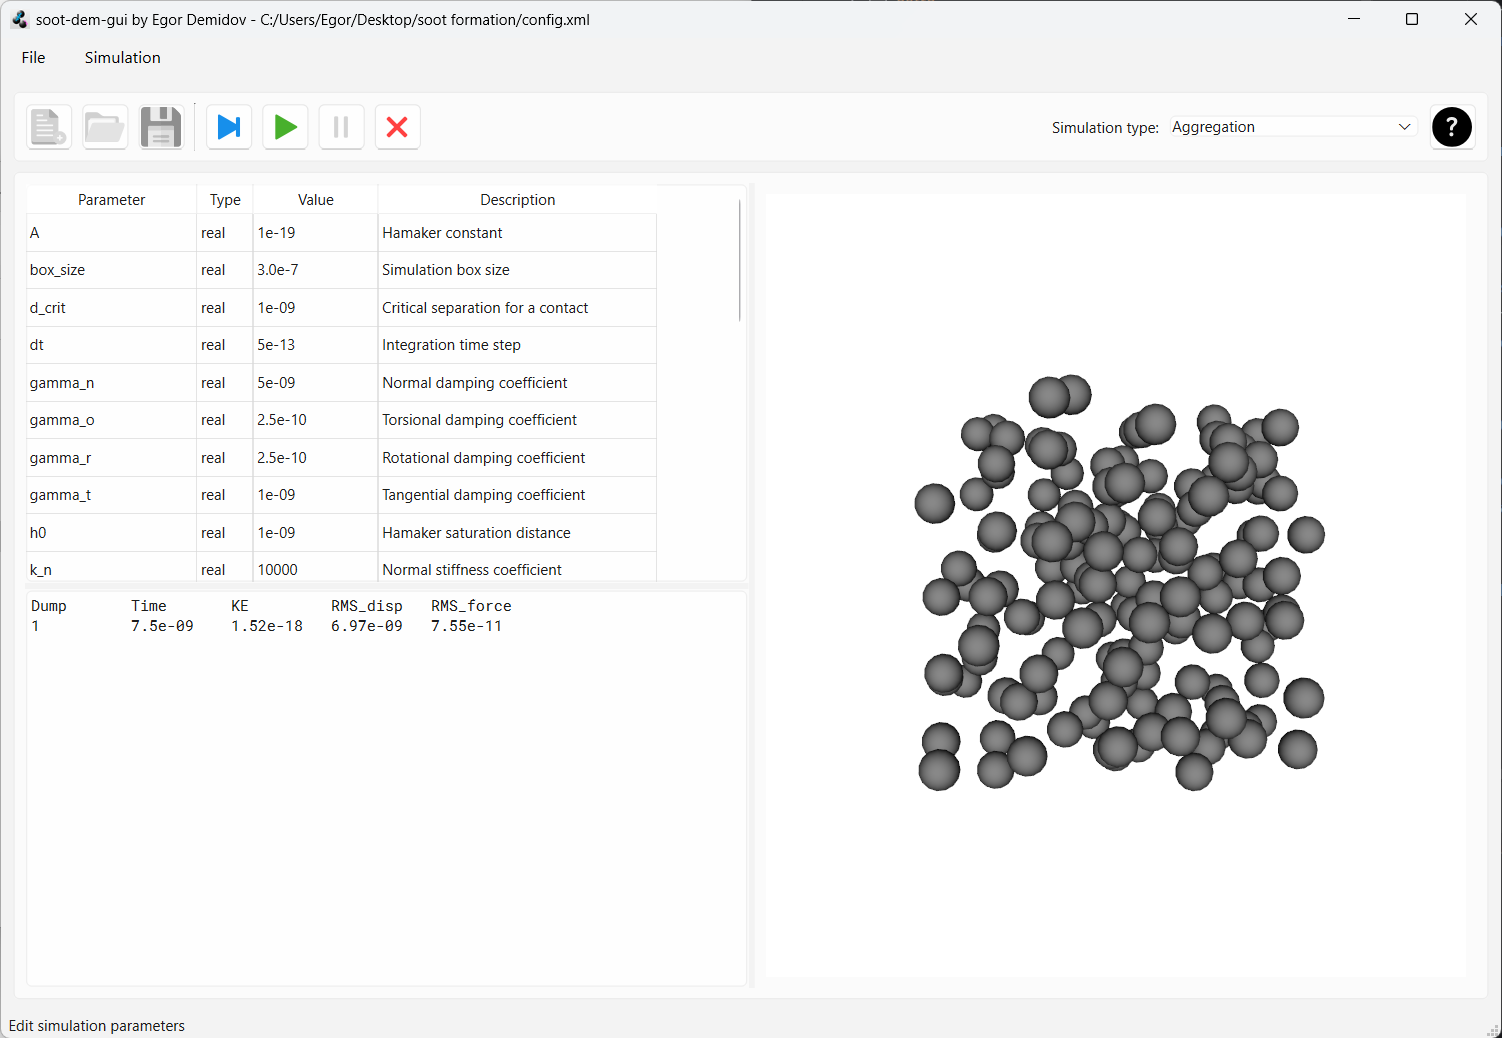
Now, to run the simulation, we have two options. We can press the blue “play one frame” button to advance to simulation until the next data dump and pause. We can also press the green “play” button to advance the simulation continuously until we manually pause it. First, let’s try advancing the simulation by one dump. Press the blue “play one frame” button. If no errors occur, the simulation should initialize, advance by a little bit, and pause. A preview should appear in the panel on the right and one line of data should be appended to the data dump text box. Note that after the simulation has been initialized, it is impossible to save, open, or modify the configuration. Before any parameters can be changed, the simulation has to be reset.
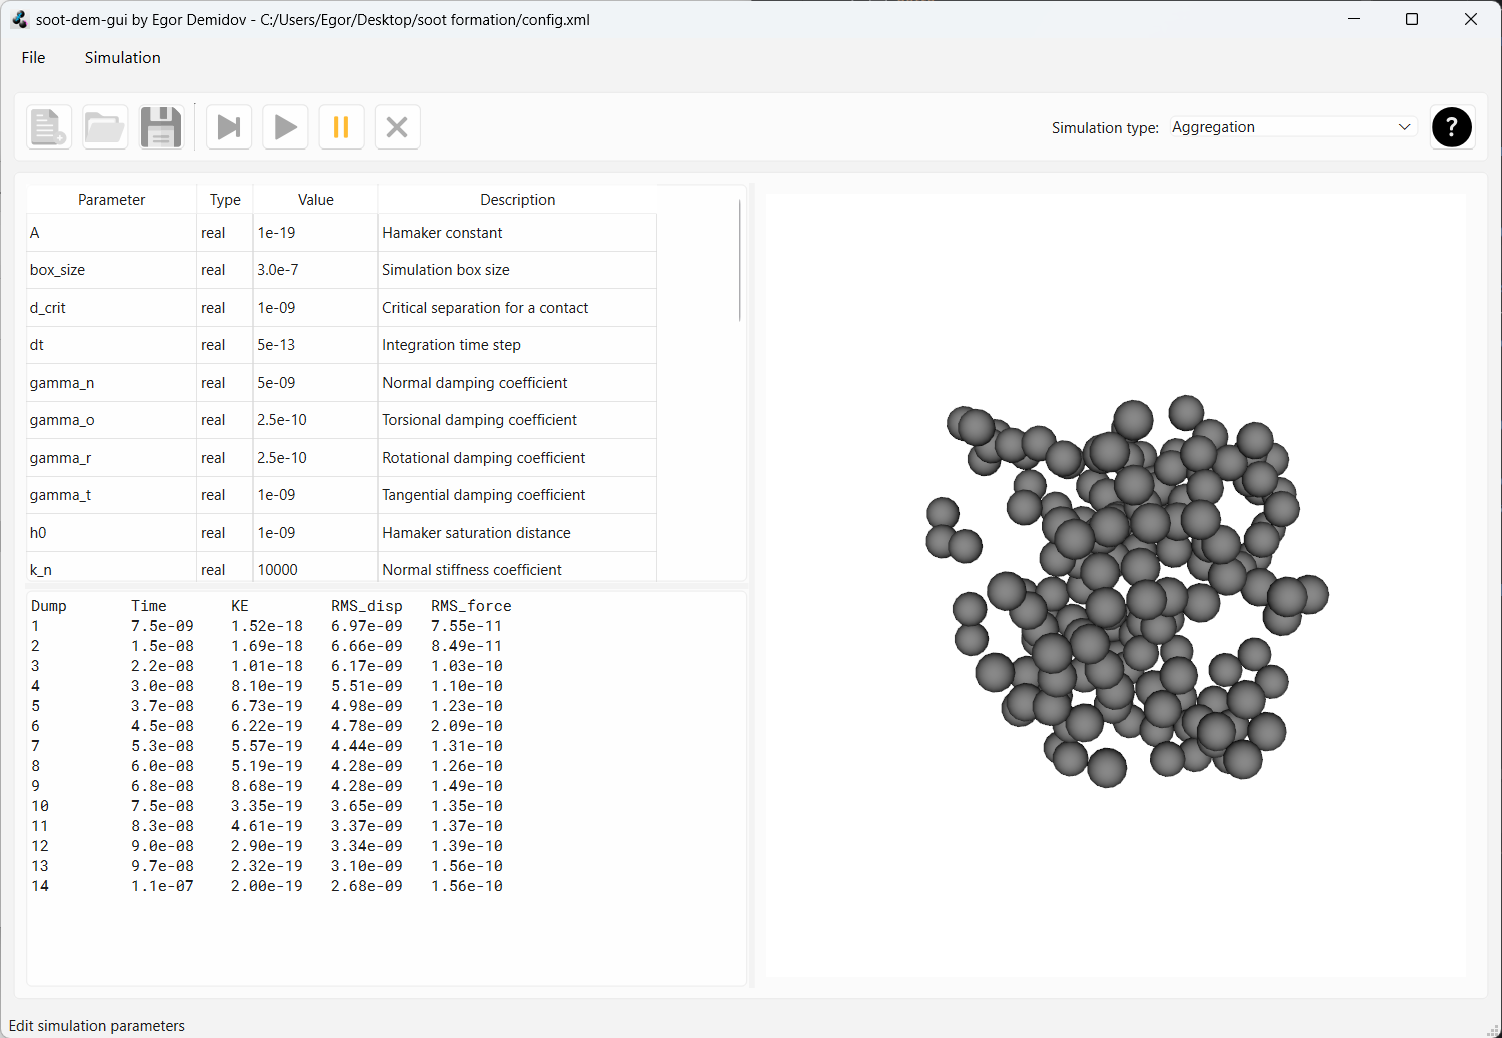
Now, let’s press the green “play” button to run the simulation continuously. You should see the particles move and start to agglomerate. Data should keep appearing in the dump textbox.
Around dump 100, all particles have clumped into one aggregate. We can pause the simulation by pressing the “pause” button.
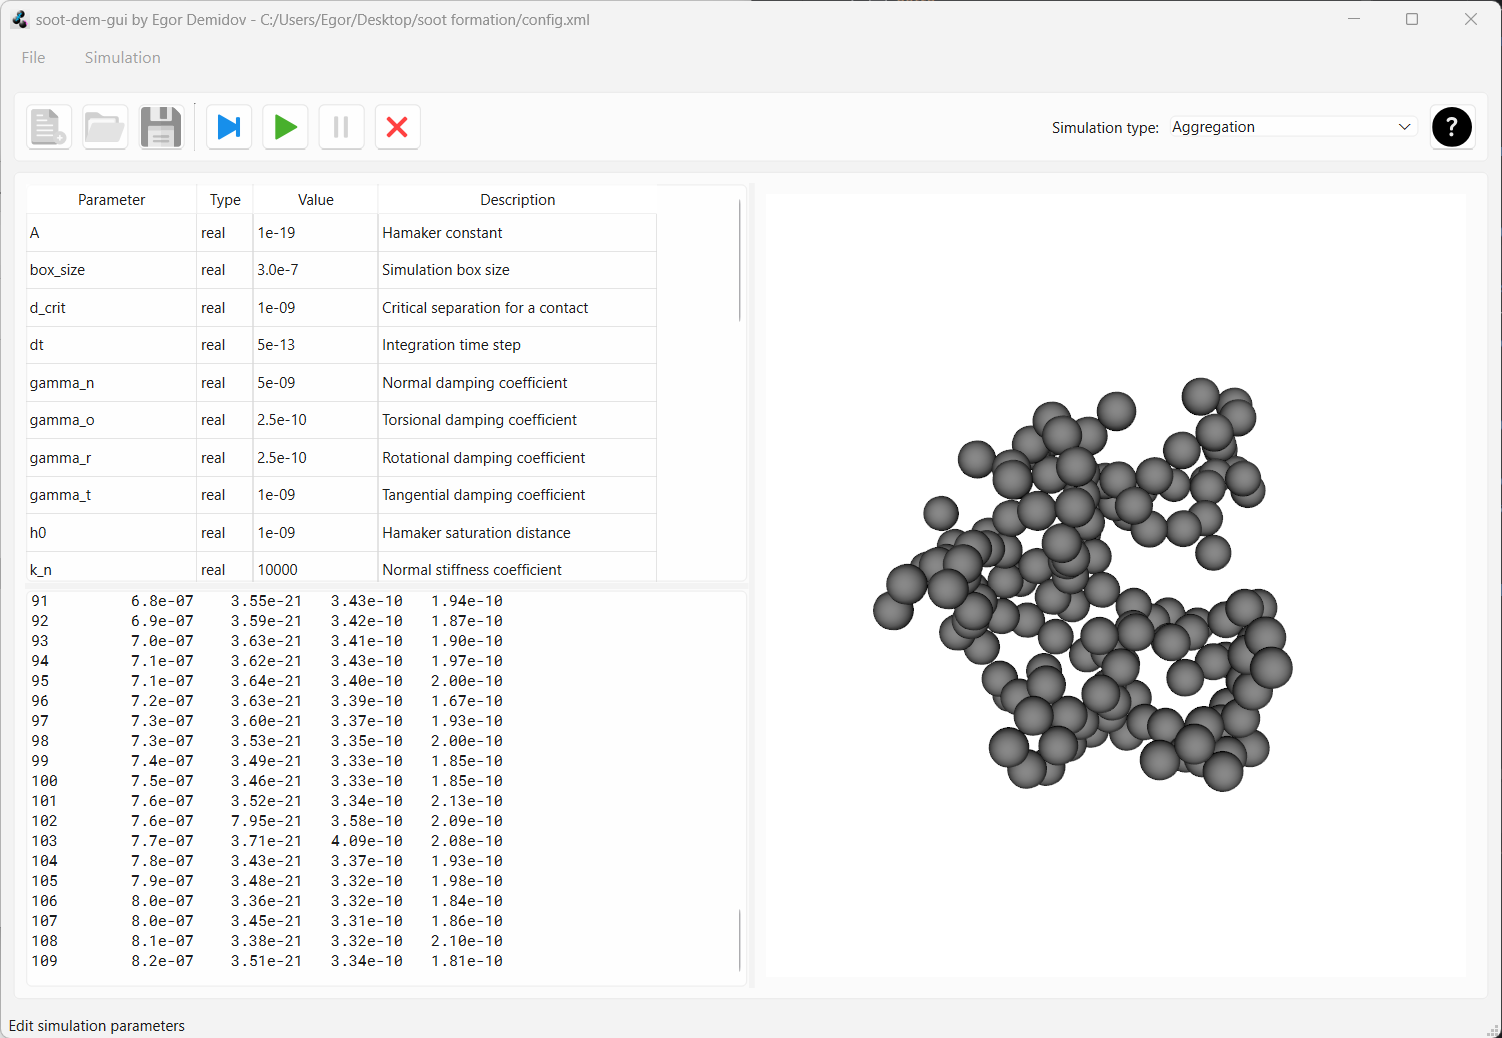
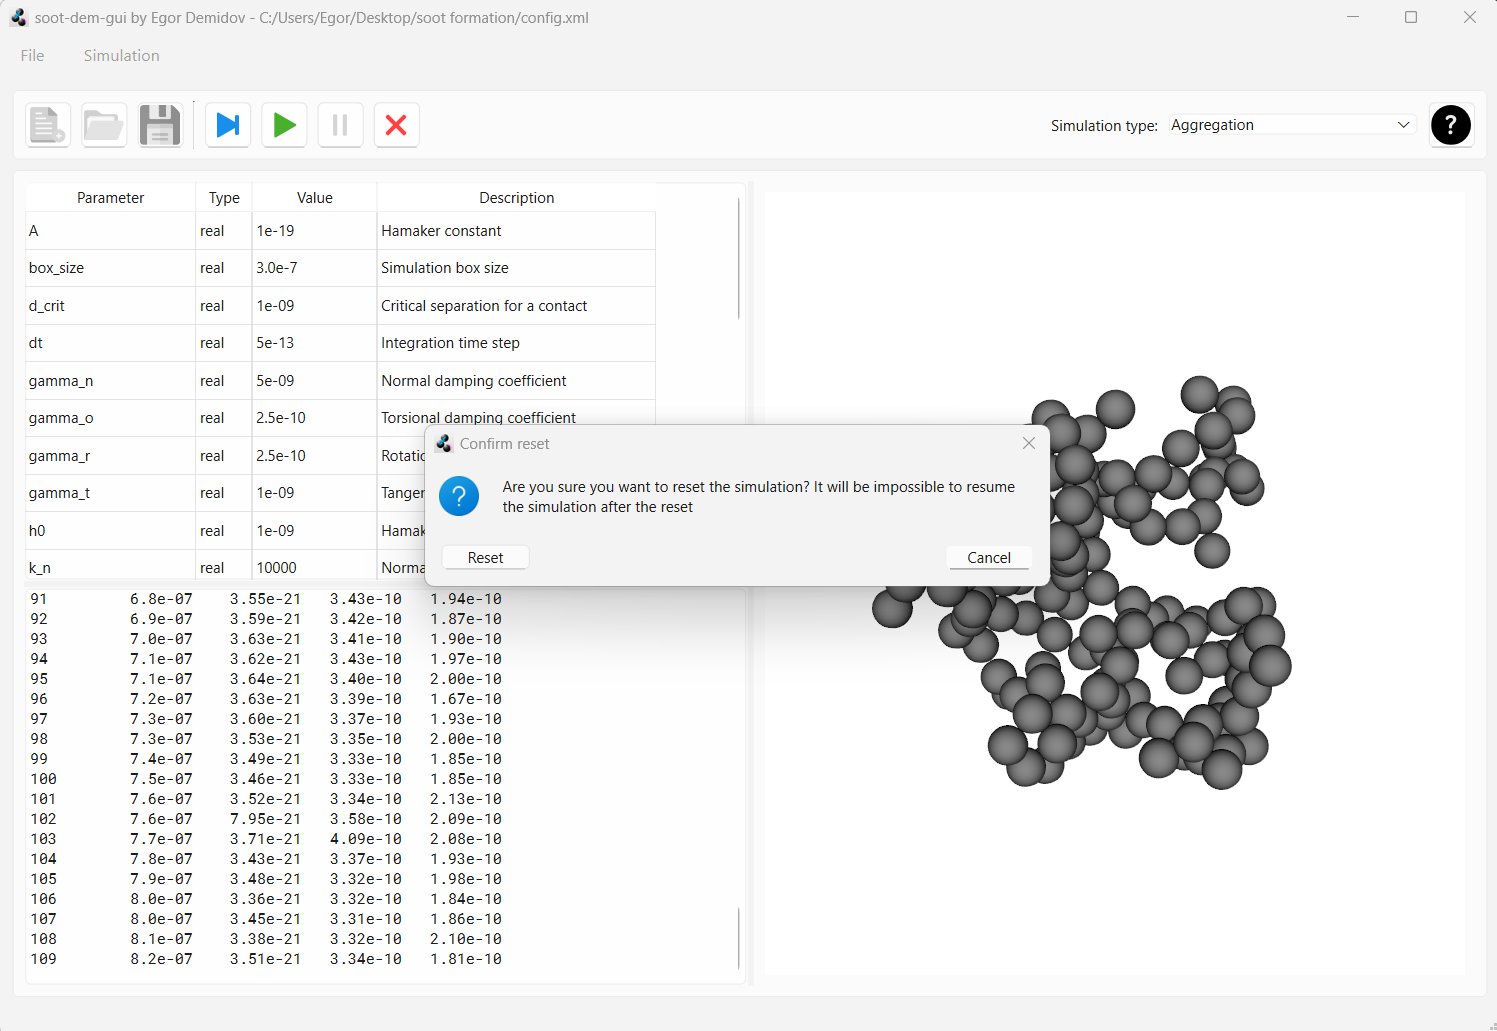
All geometry files have been written to the drive. So, we can press the “reset” button that looks like a red cross to unlock config editing and to be able to start a new simulation. When the “reset” button is pressed, a warning will pop up. Confirm that you want to reset the simulation state.
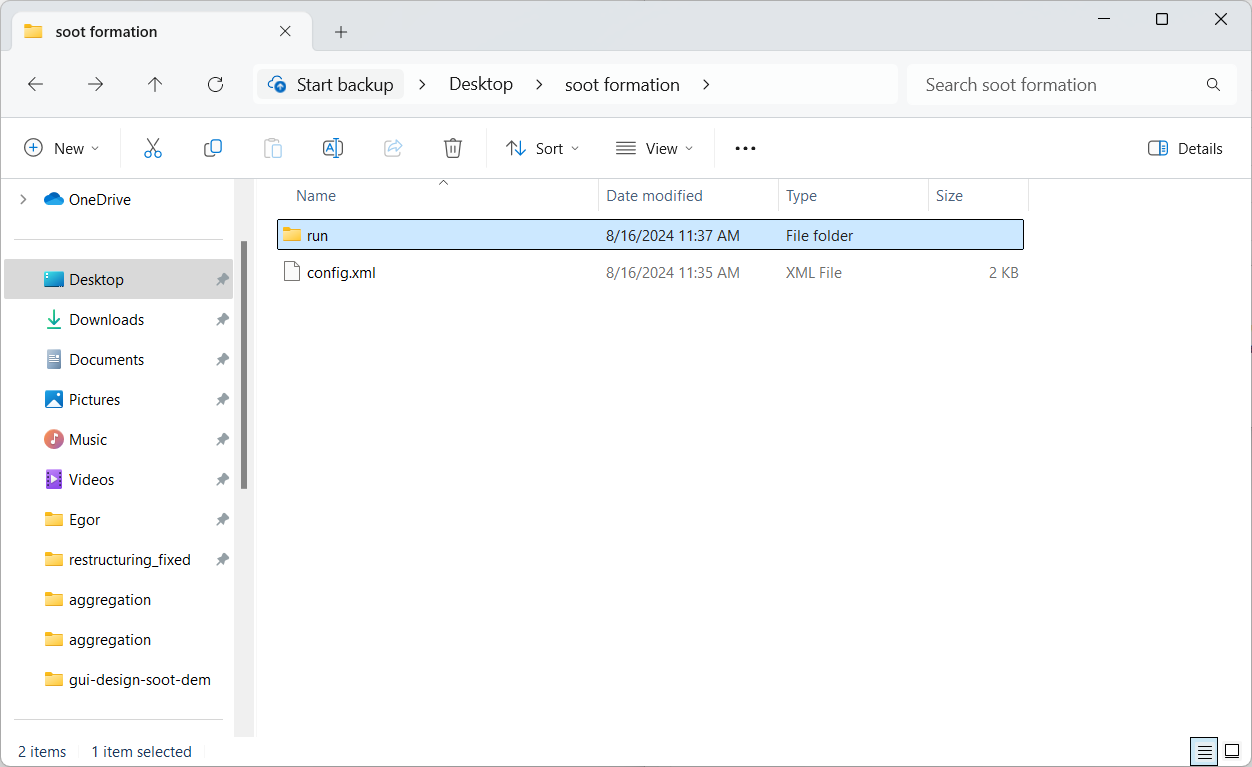
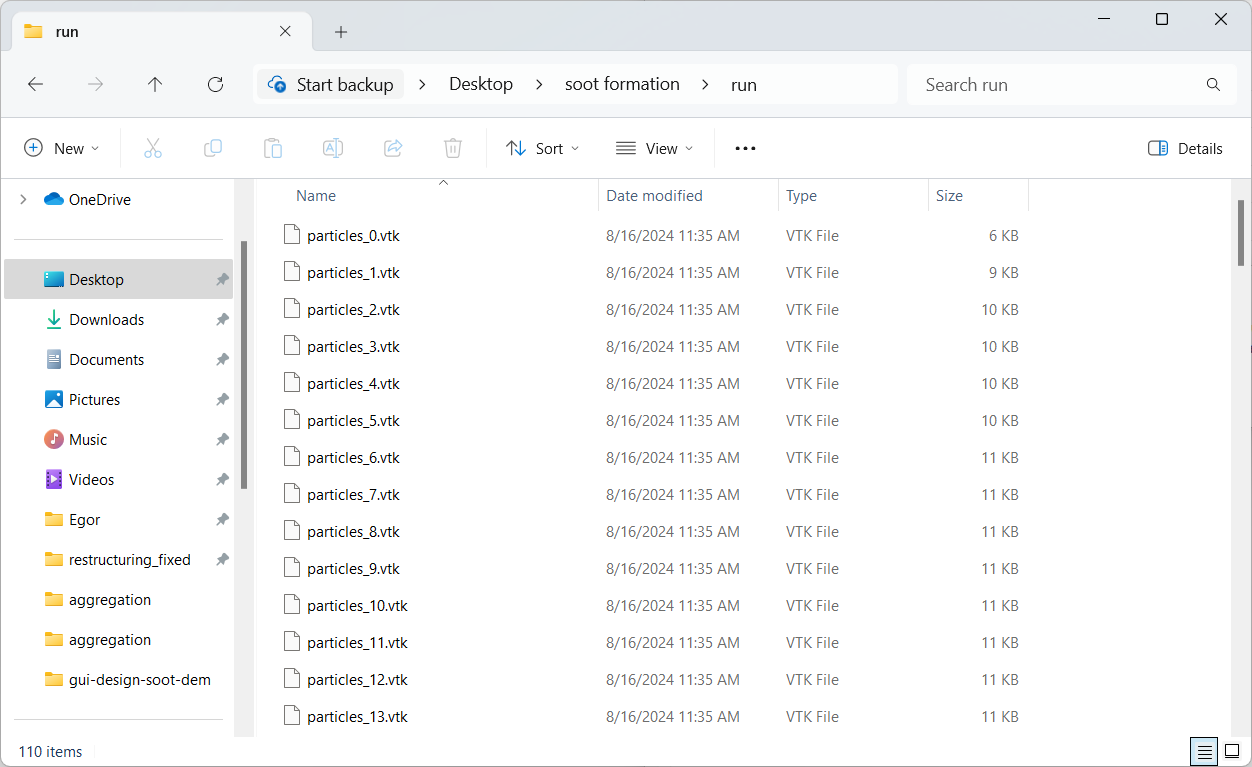
Now, open the folder “soot formation”, where the aggregation config file was saved. There should now be a folder named “run” next to the config
file with .vtk files that contain particle positions at every data dump. We will be using particles_100.vtk as the starting
aggregate in our restructuring simulation in Part 4.
Note: simulations may require randomness for certain parts of system initialization. In this case, primary particles
are assigned initial velocities in random directions at the start of the simulation. In order for simulations to be
reproducible, we do not use the operating system’s random device to seed the random number generation algorithm. Instead, the RNG seed is
provided by the user through the rng_seed configuration parameter. Thus, in order to collect statistics from multiple
simulations, the rng_seed parameter must be varied between the simulations.
Part 4: running a restructuring simulation
Now, let’s restructure the fractal aggregate that was generated in the previous step. Once the previous simulation has been
reset, press “Open” and navigate to the “examples” folder again. This time, open the config inside the folder “restructuring_fixed”.
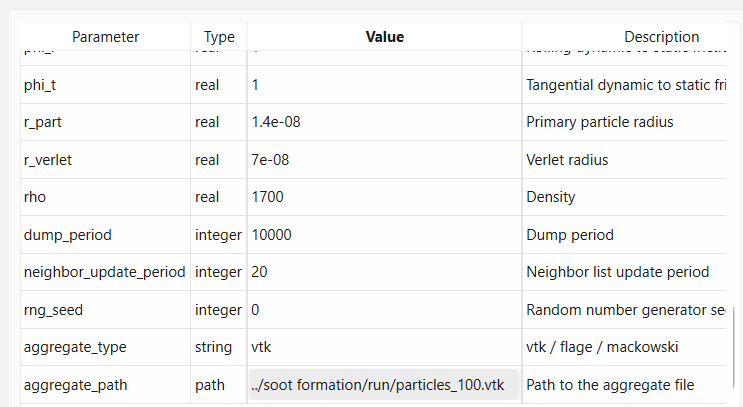
Scroll to the bottom and change parameter aggregate_type to vtk and aggregate_path to ../soot formation/run/particles_100.vtk.
Unlike aggregation simulations, restructuring simulations require a file with initial geometry of the aggregate to be provided
as an input. Aggregates can be provided in three different formats and one of them, vtk, is the output format of soot-dem-gui.
Alternatively, fractal-like aggregates generated by
FLAGE tool by
Krzysztof Skorupski
can be used to initialize restructuring simulations.
Parameter aggregate_path is the path to the file with aggregate geometry relative to the config file.
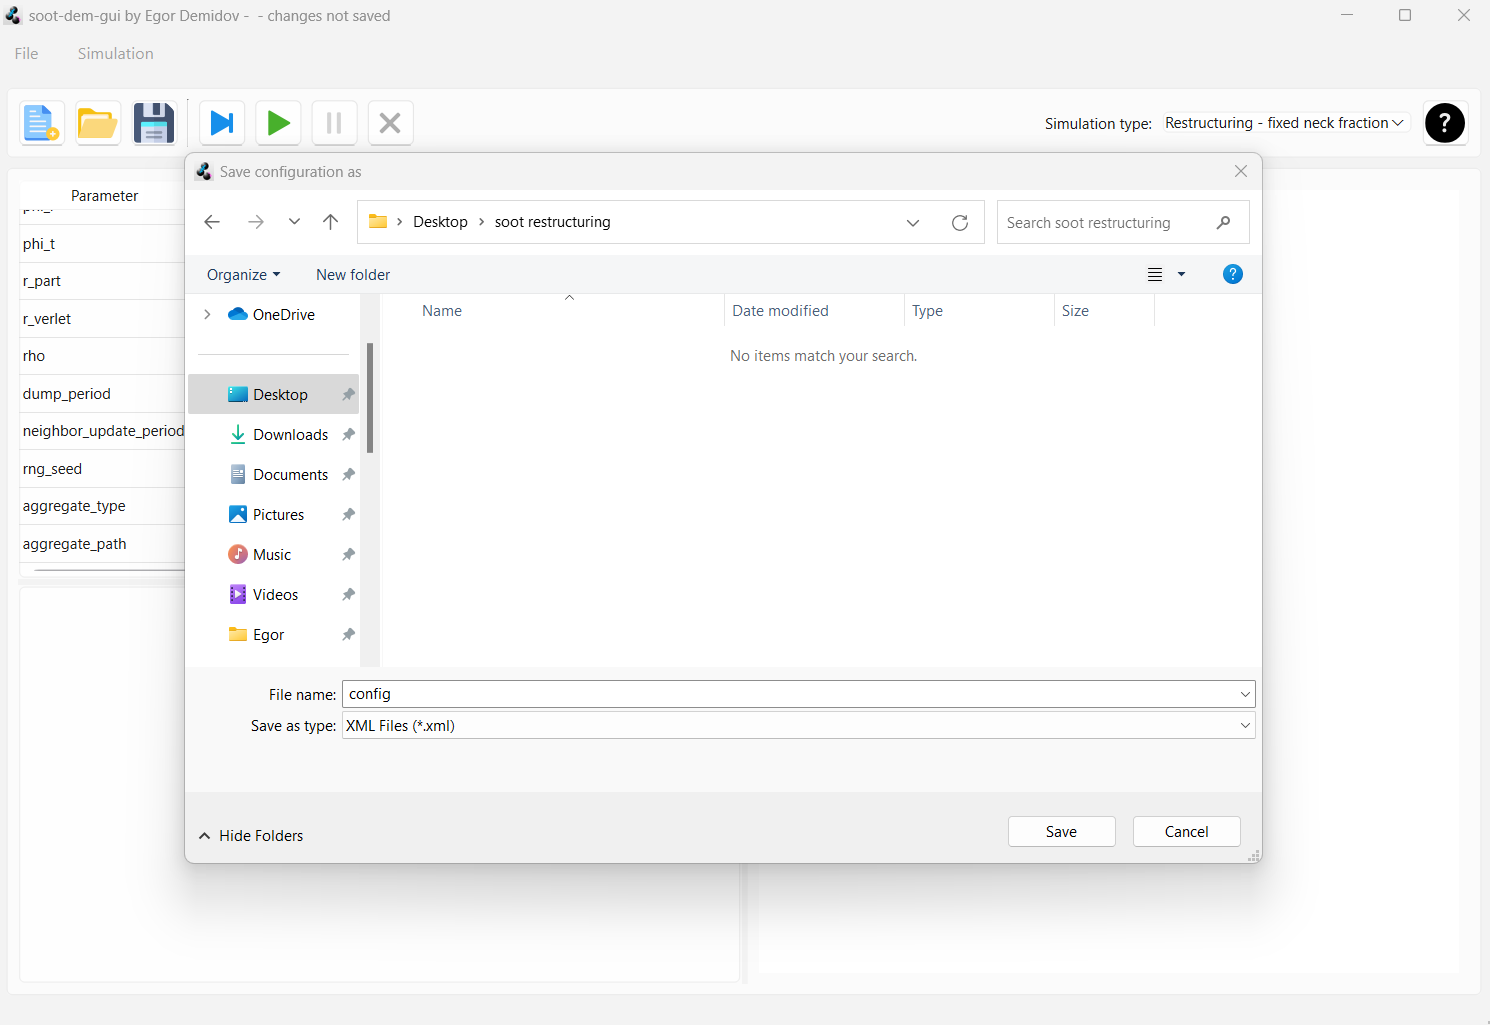
Now press “Save as”, create a folder named soot restructuring next to the folder named soot formation created in the
previous part, and save the config inside the soot restructuring folder. It is important that these project folder are next to each other
because otherwise the relative path to the aggregate geometry file specified in the config will not be correct.
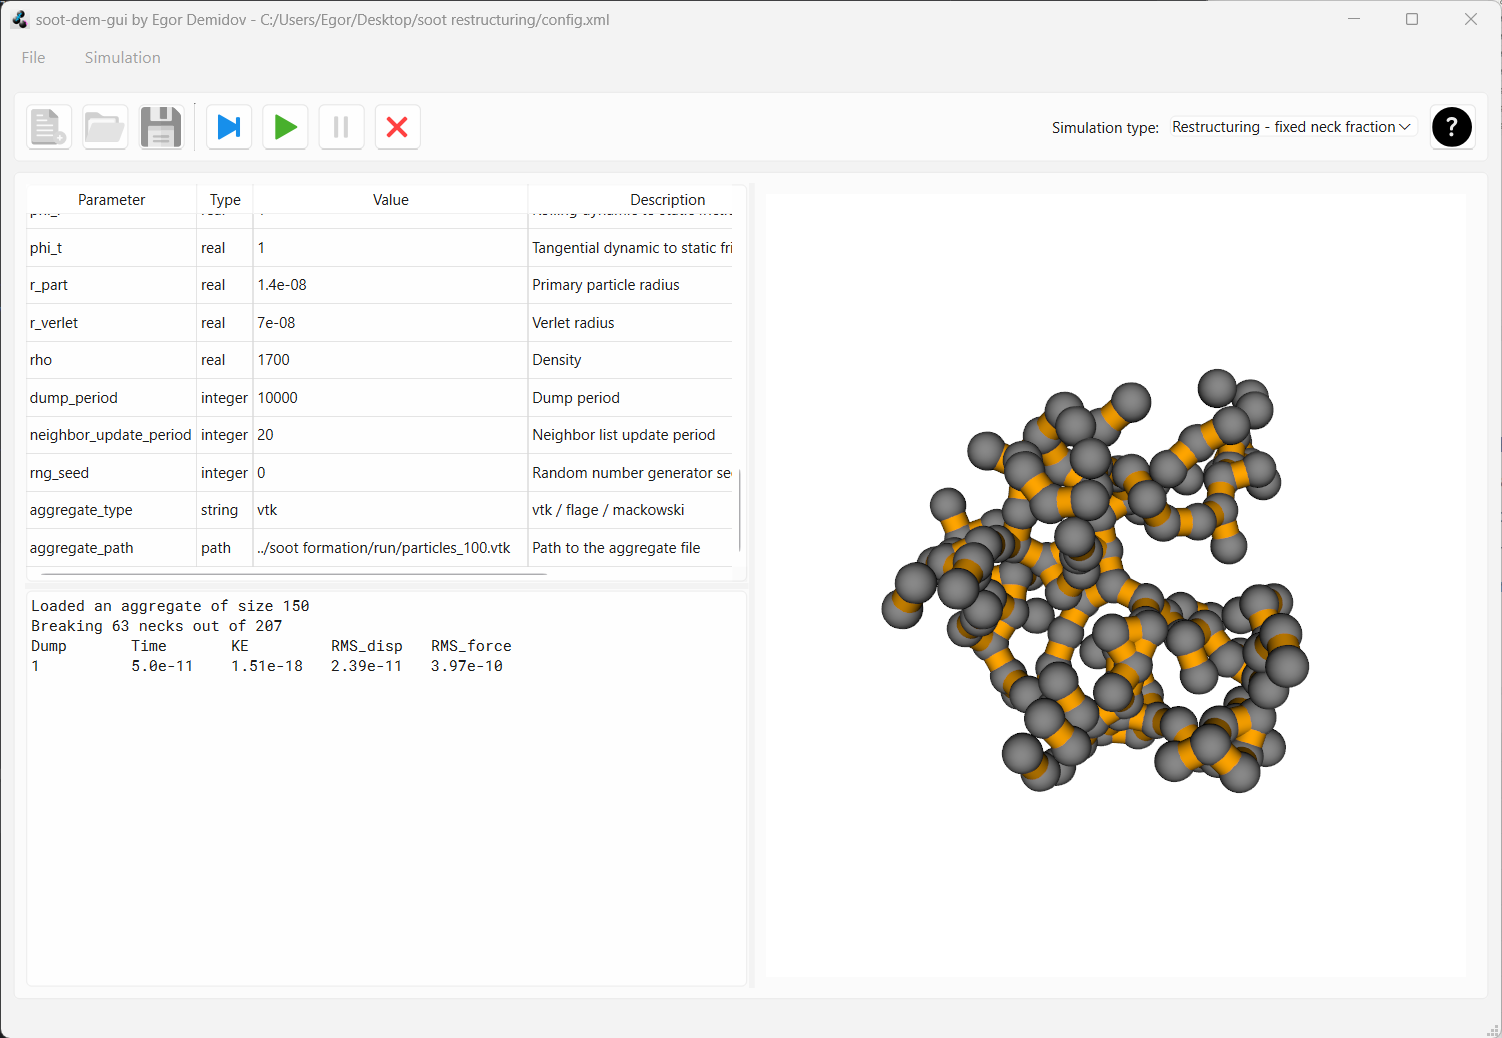
Press “Play one frame”. You should see the aggregate generated earlier appear in the preview panel. Now, some of the neighboring primary particles are bonded with elastic necks which are represented by orange cylinders in the preview.
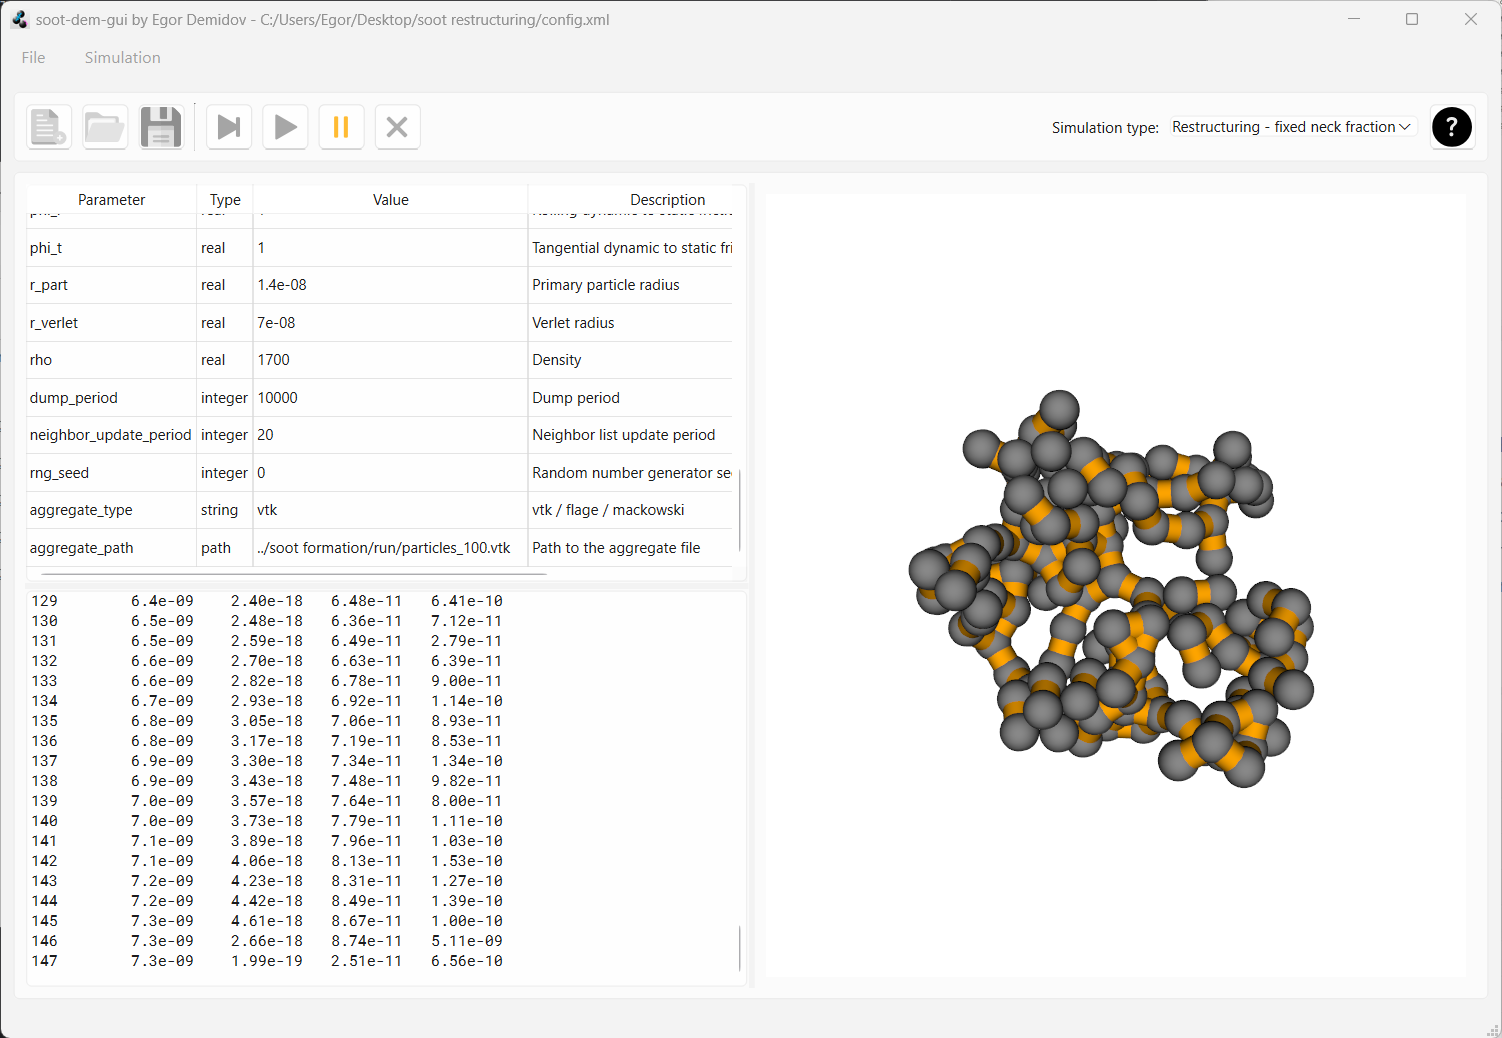
Now press play. After about 150 data dumps, you should see that the aggregate has compacted slightly.
Now reset the simulation and change the parameter frac_necks from 0.7 to 1.0. Now ALL neighboring monomers will
be connected with necks when the aggregate will be loaded (i.e. necking fraction is 1.0). Start the simulation.
After the same 150 dumps, you will see that the aggregate hasn’t moved the slightest. Full necking between primary
particles prevents motion.
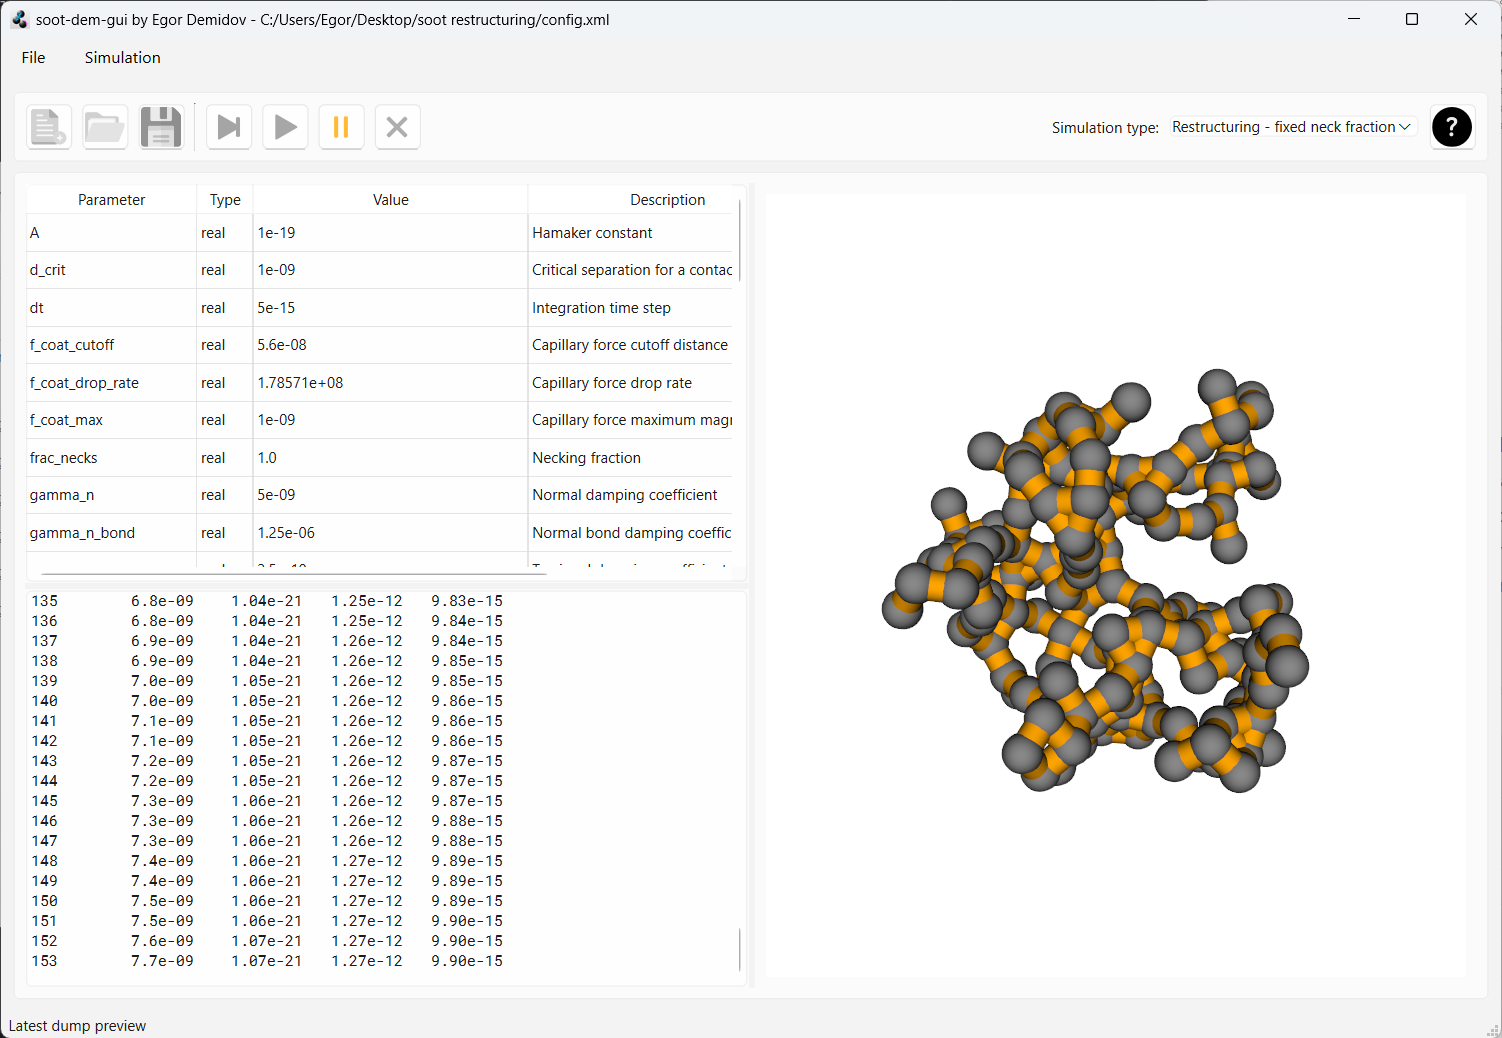
Now reset the simulation and change the parameter frac_necks from 1.0 to 0.3. Run the simulation and you
will see that a lot more compaction occurs this time.
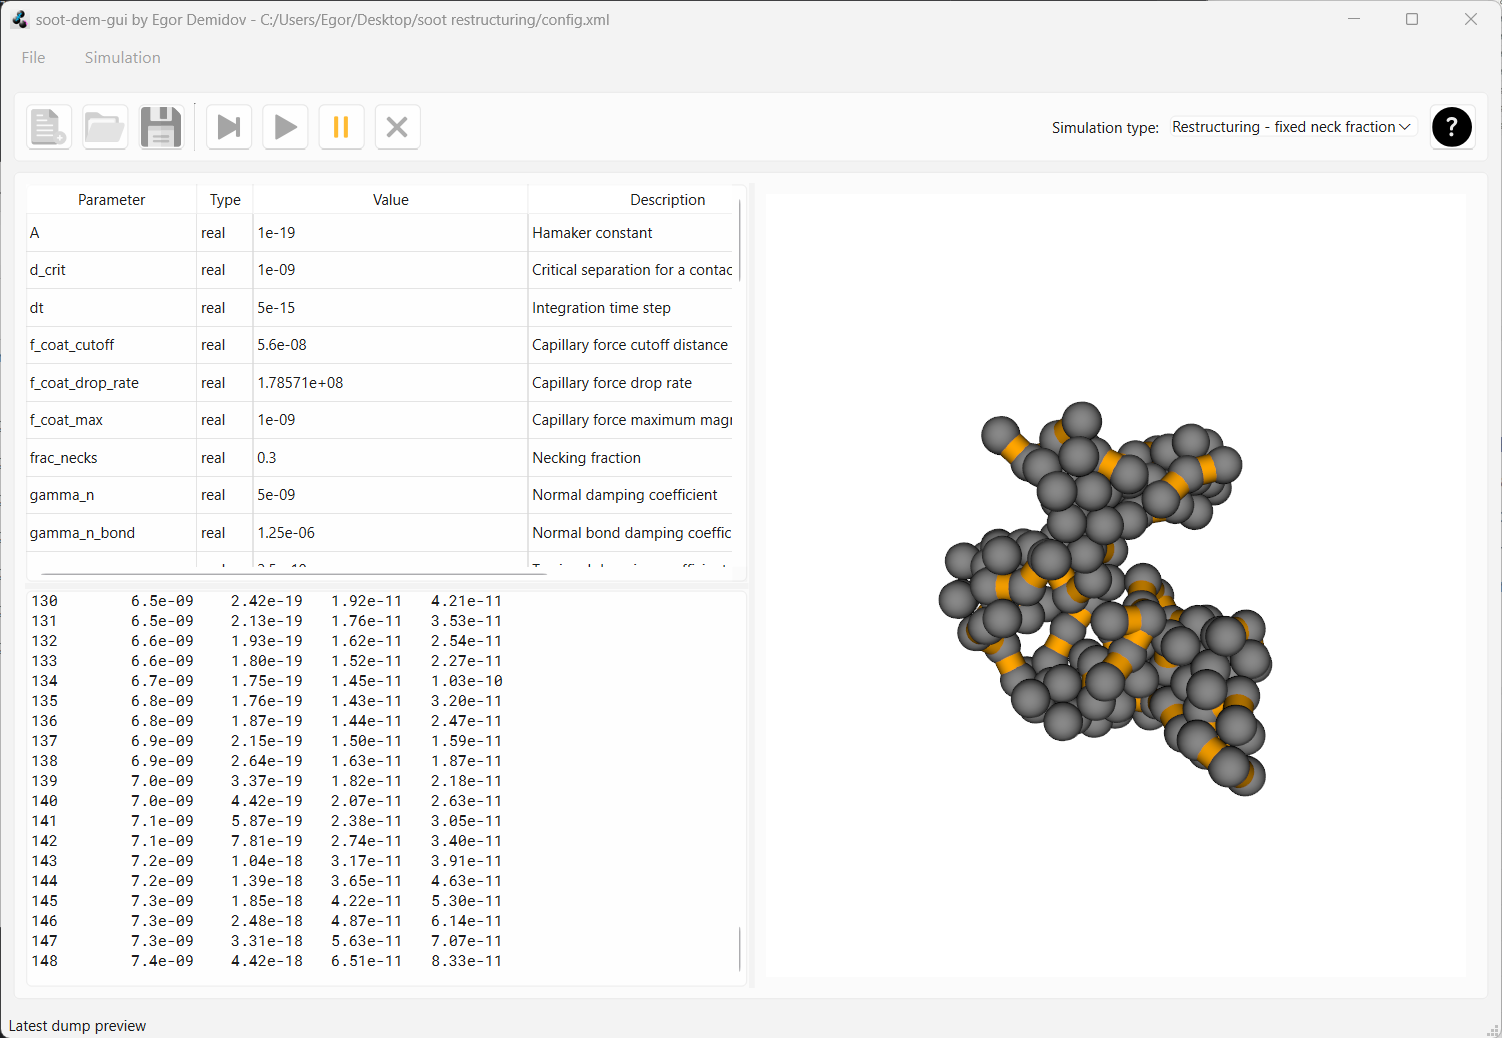
This example illustrates how soot-dem-gui can be used to study the effect of necks on soot restructuring.
Possible applications and outlook
The particles_XXX.vtk dumps from DEM simulations contain positions of every primary particle, their velocities, and angular velocities.
These files can be post-processed to derive information about fractal, geometrical, and optical properties of aggregates.
In simulations involving necks, neck positions, orientations, and indices of primary particles connected to each neck
are also dumped in a series named necks_XXX.vtk.
More details about neck dumps
Indices of monomers connected to each neck are stored in the .vtk files as an array of tuples.
The number of tuples matches the number of necks in the system and each tuple contains two integers, corresponding to
the indices of two monomers connected to the respective neck. Monomers are zero-indexed in the order that they appear in
the respective particles_XXX.vtk file.
To restore monomer-monomer connections from these dump files, connections between monomers can be represented by a symmetric matrix. For example, if in a system with 5 primary particles the half-connectivity matrix is:
then, using zero-indexing, monomers , , , and are connected. Diagonal elements are obviously zero, because a monomer cannot be connected to itself. The other half of the matrix it then the mirror image of , because if monomers are connected, then so are monomers . Thus, the full connectivity matrix representing all possible connections in the system, is:
To recover from the connections array in a necks_XXX.vtk file, the following algorithm can be used:
std::vector<std::pair<size_t, size_t>> connections;

/* Initialize the connections vector... */

bool connections[N_PART*N_PART] {false};  // the C-matrix

for (auto [index1, index2] : connections) {
    connections[index1*N_PART + index2] = true;
    connections[index2*N_PART + index1] = true;
}
In future releases, the following simulations will be added to soot-dem-gui:
- Restructuring with dynamically breaking necks
- AFM force spectroscopy (with tip and substrate)
Issue reporting and feedback
We welcome any issue reports, feedback, and feature requests. They can be submitted by email to ed242@njit.edu or through the online form.
Attribution
If you use our soot restructuring module for work that will be published, please cite:
@misc{demidov2024discrete,
    title={Discrete element method model of soot aggregates},
    author={Egor V. Demidov and Gennady Y. Gor and Alexei F. Khalizov},
    year={2024},
    eprint={2407.14254},
    archivePrefix={arXiv},
    primaryClass={physics.comp-ph},
    url={https://arxiv.org/abs/2407.14254}
}
Acknowledgement
- Project funded by U.S. National Science Foundation, award #AGS-2222104